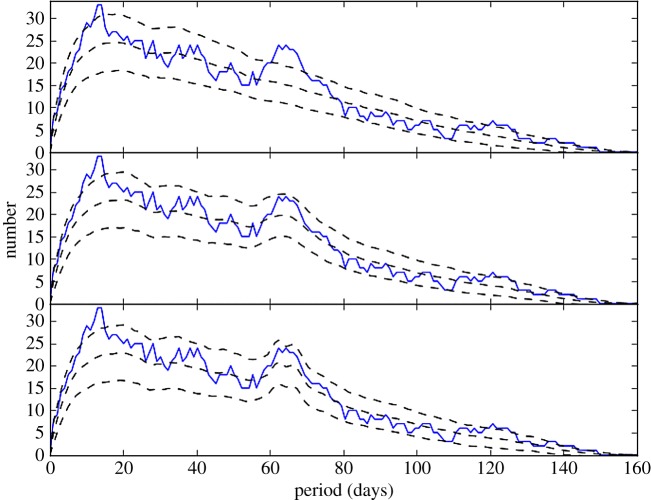
Figure 6.
Power at a given period from the iterative event finding. The solid line shows the power from the data, and is the same in each panel. The dashed lines show the mean and ±1σ power from simulated dimming events, which from top to bottom are: random, periodic between 64 and 75 days with three repeats, and periodic at 64 days with 10 repeats.

