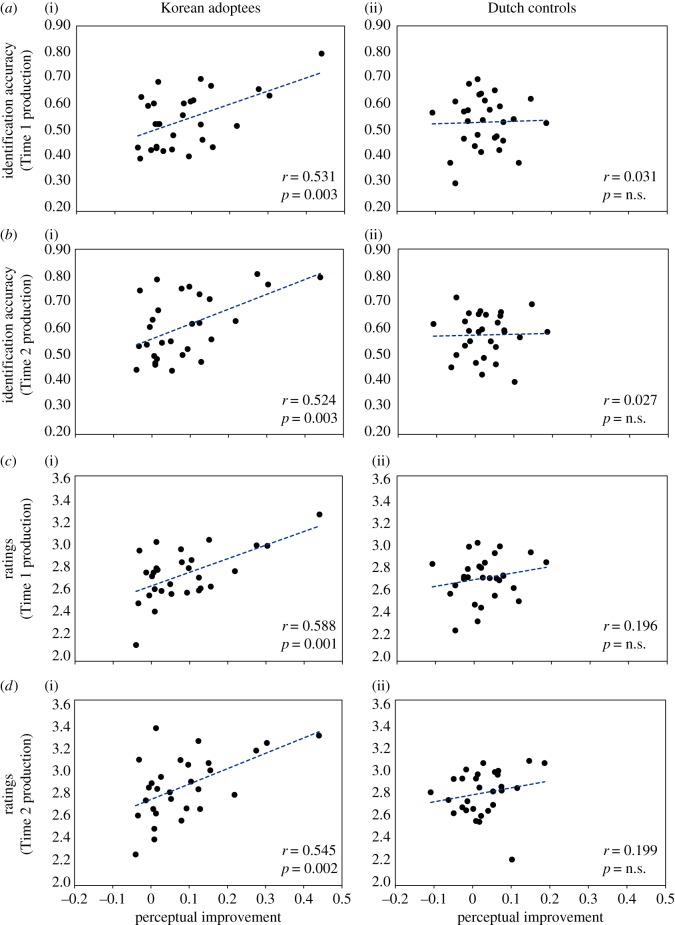
Figure 3.
Scatter plots with regression lines comparing improvement across participants in perceptual identification accuracy from pre- to midway test (x-axis) against (a) Time 1 identification accuracy, (b) Time 2 identification accuracy, (c) Time 1 ratings and (d) Time 2 ratings (y-axis) for individual speakers, separately for adoptees (i) and Dutch controls (ii). Pearson correlation coefficients and corresponding p-values are shown in the bottom right of each plot. For the adoptees only, perceptual improvement correlates significantly with all production assessment results.

