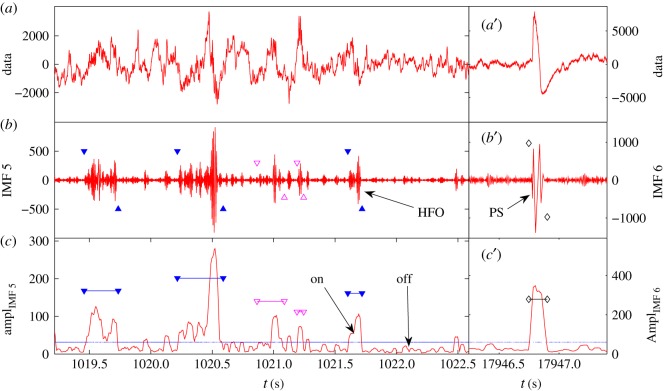
Figure 7.
Example of successful HFO and PS detection. (a) Original EEG data plot of about 3 s. (b) IMF 5 plot with solid blue triangles marking the ripples and open magenta triangles marking the fast ripples. (c) The amplitude of IMF 5. The horizontal blue line is the threshold for separating on/off intervals of HFOs. The threshold is calculated from the amplitude data segment of about 1 h. The computational parameters are and . (a)–(c) The original data, IMF 6, and its amplitude function, respectively. The black diamonds mark the position of the population spikes.

