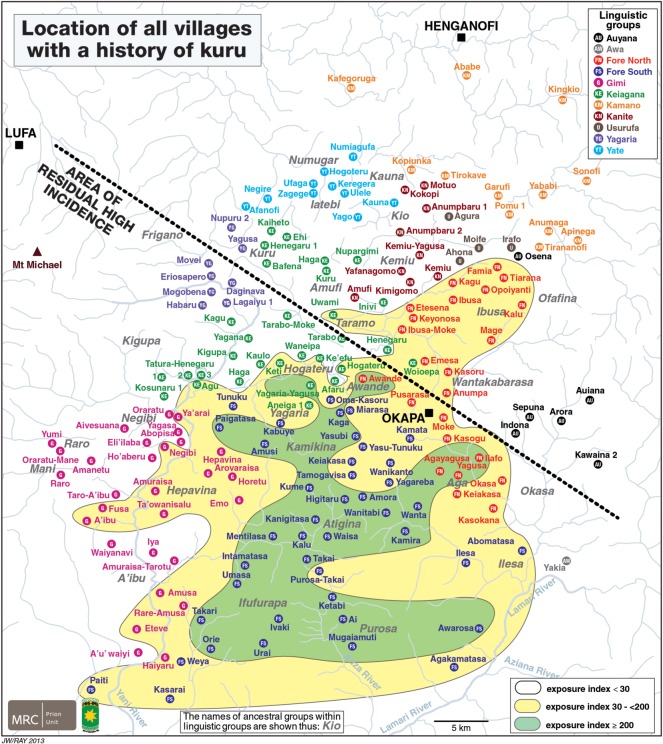
Figure 4.
The map shows all villages with a history of kuru. The black dotted line denotes the region of residual high incidence to the south of the line. The coloured areas demarcate the range of EI in villages of the kuru-affected region. The area of highest incidence has an EI of greater than or equal to 200, the area surrounding this an EI of 30 to less than 200, and the peripheral areas an index of less than 30. Based on a figure from Alpers and Kuru Surveillance Team, 2005 [2].

