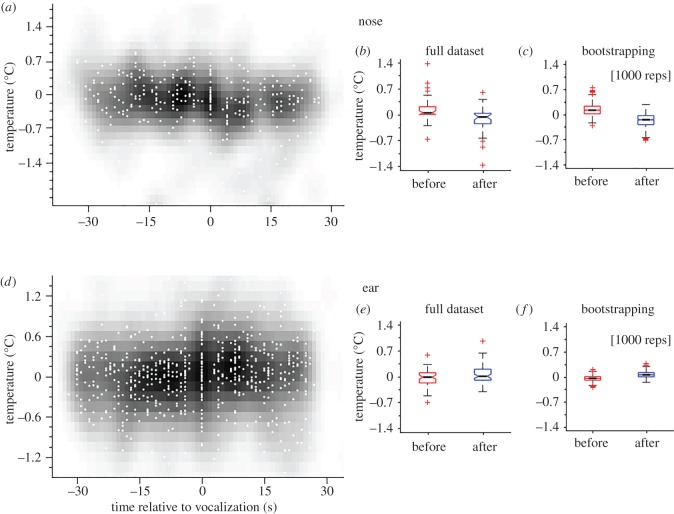
Figure 3.
Full dataset, distribution and bootstrapping. (a,d) The full dataset is displayed in degree change from the baseline (y-axis) as a function of time (x-axis). Grey-scale clouds indicate the density of samples at given x- and y-values determined by Gaussian blurring. (b,e) The full dataset is shown as sample before (red) and after (blue) the occurrence of the vocalization. The black central line indicates the median, the box the first and third quartiles, whiskers the minimal and maximal values and asterisks the potential outliers. (c,f) Bootstrapped data are shown as the distribution of 1000 randomly chosen sets containing of 10% of the full dataset. Panels (a–c) display the changes of temperature in the nose, (d–f) display the changes of temperature in the ear.

