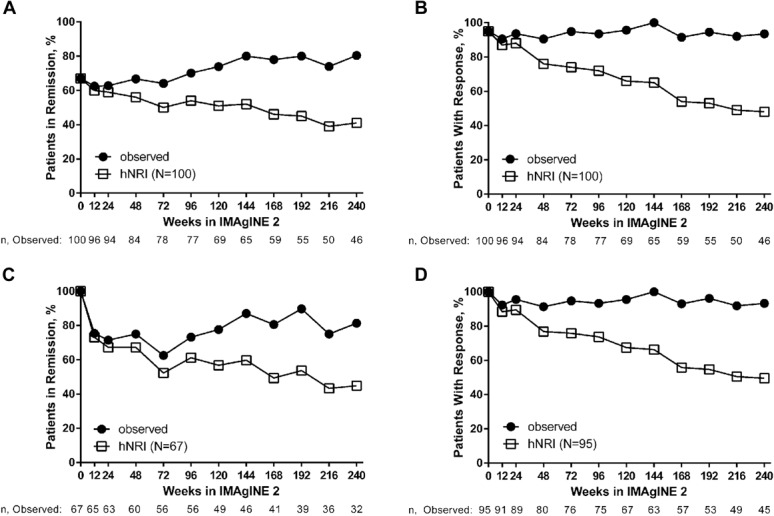
FIGURE 2.

Long-term clinical remission and response rates with adalimumab treatment in patients who entered IMAgINE 2 (N = 100). A, Proportion of patients in remission over time. B, Proportion of patients with response over time. C, Proportion of patients in remission over time who entered IMAgINE 2 in remission (n = 67). D, Proportion of patients with response over time who entered IMAgINE 2 with response (n = 95).
