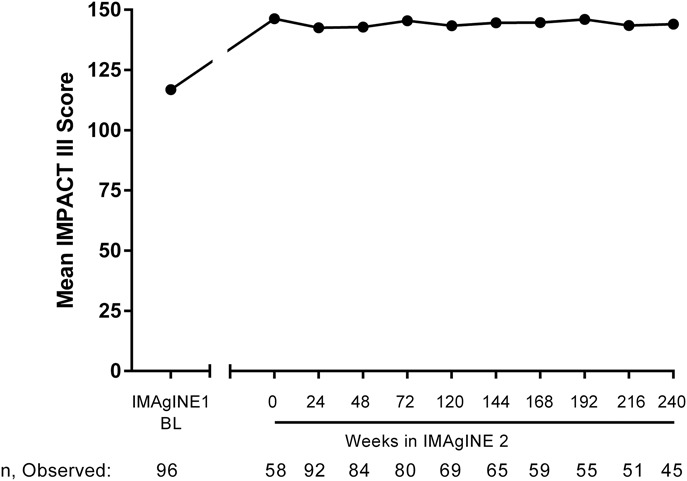
FIGURE 3.

Mean IMPACT III score over time in patients who entered IMAgINE 2. Results at IMAgINE 1 baseline for patients who entered IMAgINE 2 are shown for reference, as observed analysis. BL, baseline.

Mean IMPACT III score over time in patients who entered IMAgINE 2. Results at IMAgINE 1 baseline for patients who entered IMAgINE 2 are shown for reference, as observed analysis. BL, baseline.