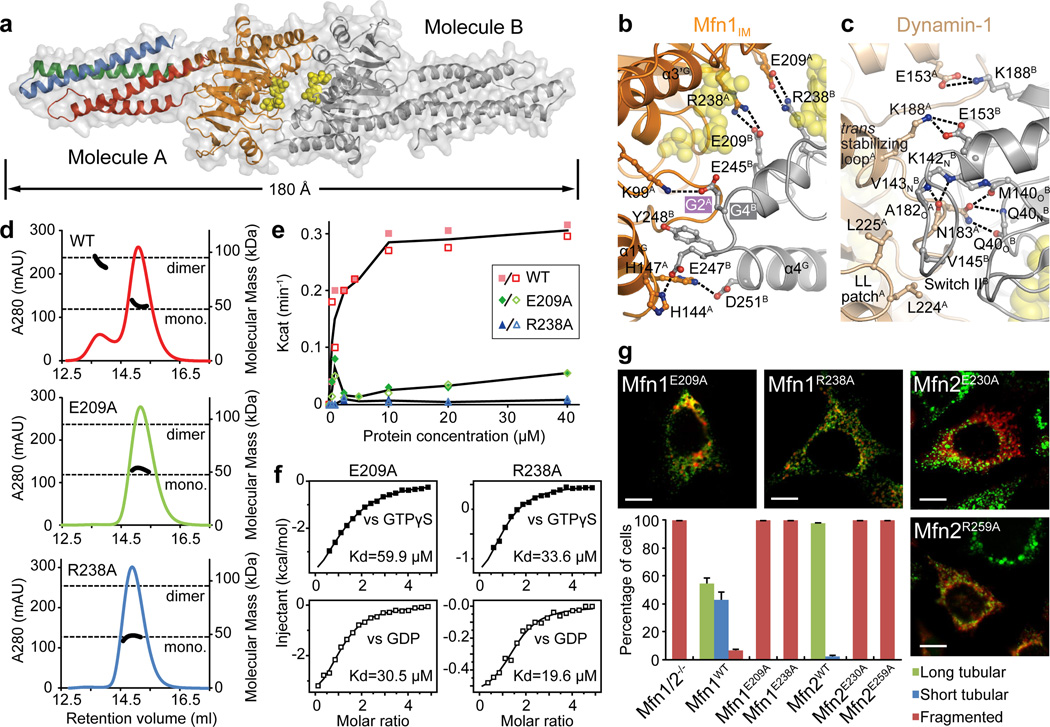
Figure 3. Dimerization of Mfn1IM via G domain.
a, Mfn1IM dimer in the transition-like state, with transparent surface representation. Molecule A is coloured as in Fig. 1b, molecule B in grey. GDP is shown as yellow spheres.
b, Details of the G interface of Mfn1IM. Only one side of the G interface is shown for other involved residues.
c, Details of the G interface of human Dynamin-1 in the transition state (Protein Data Bank code 2×2E). Region corresponding to b is shown.
d, Dimerization properties of Mfn1IMWT, Mfn1IME209A and Mfn1IMR238A in the presence of GDP•AlF4− were assayed in analytical gel filtration coupled to RALS. Calculated molecular masses at the absorption peak of 280 nm are plotted in black.
e, GTP turnover rates of Mfn1IMWT, Mfn1IME209A and Mfn1IMR238A were measured at 7 different protein concentrations. For each group, the averages of Kcat values from two separate experiments at each protein concentration are traced by line charts
f, Binding affinities to GTPγS and GDP for Mfn1IME209A and Mfn1IMR238A.
g, Mitochondrial elongation assay with quantification for Mfn1E209A, Mfn1R238A and related mutants Mfn2E230A, Mfn2R259A. For each construct, 100 cells were scored in biological triplicate; representative images are shown. Error bars indicate standard errors. Scale bar is 10 µm.

