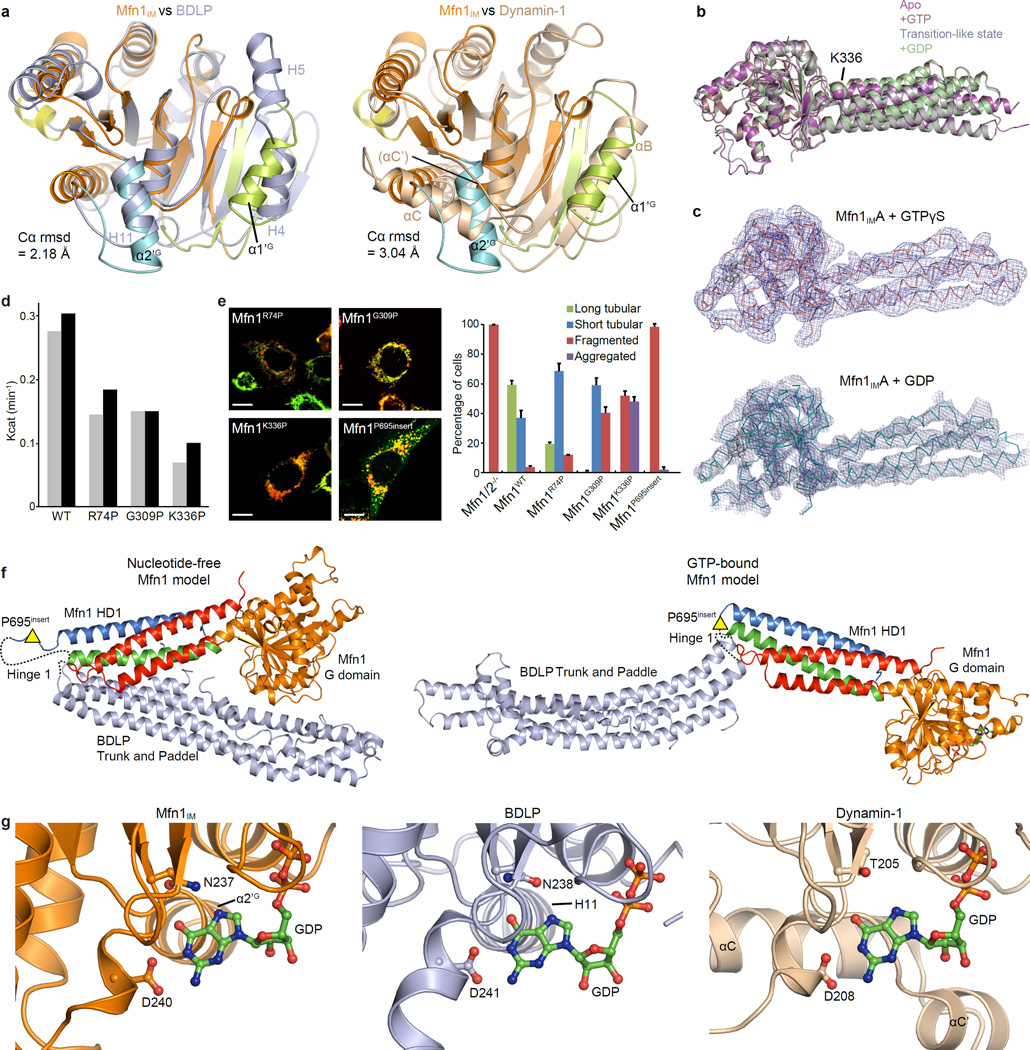
Extended Data Figure 5. Structural comparison of Mfn1IM with BDLP and Dynamin-1.
a, Structural comparison of the G domains between Mfn1IM and BDLP (left) or Dynamin-1 (right) in the nucleotide-free state. The Mfn1 G domain (coloured as in Fig. 1b) is separately superimposed with G domains of BDLP (2J69, light blue) and of rat Dynamin-1 (2AKA, wheat). The root mean standard deviation (rmsd) of aligned Cα atoms are indicated. α-helices on the two lobes are labelled for the three molecules. The G domain of Mfn1IM resembles the BDLP G domain, except that at lobe 1, BDLP has two separate α-helices (H4 and H5) rather than the single α1’G of Mfn1IM. Dynamin-1 is similar to Mfn1IM in lobe 1, but at lobe 2 the αC tilts 60° from its counterpart α2’G in Mfn1IM. In addition, the long loop N-terminal to αC (termed α’C with brackets) in Dynamin-1 folds into a short α-helix (αC’) when guanine nucleotide is loaded, which is not the case in Mfn1IM.
b, Structural comparison of Mfn1IM in different nucleotide-loading states. Structures of nucleotide-free Mfn1IMB, GTP-bound Mfn1IMCT109A, transition-like state Mfn1IMC and GDP-bound Mfn1IMCT109A are colour-specified and superimposed on their G domains.
c, Architectures of Mfn1IMA•GTPγS and Mfn1IMA•GDP. Shown here are the corresponding Cα traces and electron density maps with contour level at 1.2σ. The outlines of the molecules are clearly discernable from the resulting electron density maps, showing that the HD1 does not have large-scale movement relative to the G domain compared with structures shown in b. These two structures are presented to exclude the possible influence of the T109A mutation for the orientation of HD1 in the GTP- and GDP-bound structures with higher resolution.
d, GTP turnover rates of Mfn1IMWT and the Hinge 2 mutants. Results from two separated experiments are presented for each protein. Note that although all three Hinge 2 mutants had similar GTPase activities, Mfn1K336P showed much more significantly reduced activity in mediating mitochondrial elongation.
e. Mitochondrial elongation assay for Mfn1WT and the hinge mutants. For each construct, 100 cells were scored in biological triplicate; representative images are shown. Error bars indicate standard errors. Scale bar is 10 µm.
f, Full-length Mfn1 models showing the plausible Hinge 1 between HD1 and HD2. Models were based on nucleotide-free (2J69, upper) and GMPPNP-bound (2W6D, lower) BDLP. G domain and HD1 are coloured as in Fig. 1b, and HD2 in light blue. Hinge 1 was shown as dashed lines. The approximate position for the P695 insert was indicated by yellow triangles.
g, Extra support of the guanine base in Mfn1, BDLP (2J68) and Dynamin-1 (5D3Q). GDP-bound structures of Mfn1IMCT109A (coloured as in Fig. 1c), BDLP (light blue) and Dynamin-1 (wheat) are shown in ribbon-type representations. The nucleotides and the residues on G4 element involved in guanine base coordination are shown as ball-and-stick models. The α-helices in the G domains that support the guanine base are specified. Part of the G domains are removed for clarity. Note that for Mfn1IM and BDLP, the α2’G and H11 only loosely associate with one side of the guanine base, whereas αC of Dynamin-1 (corresponding to α2’G in Mfn1IM) tightly wraps the guanine base from a parallel orientation together with a specific element αC’.

