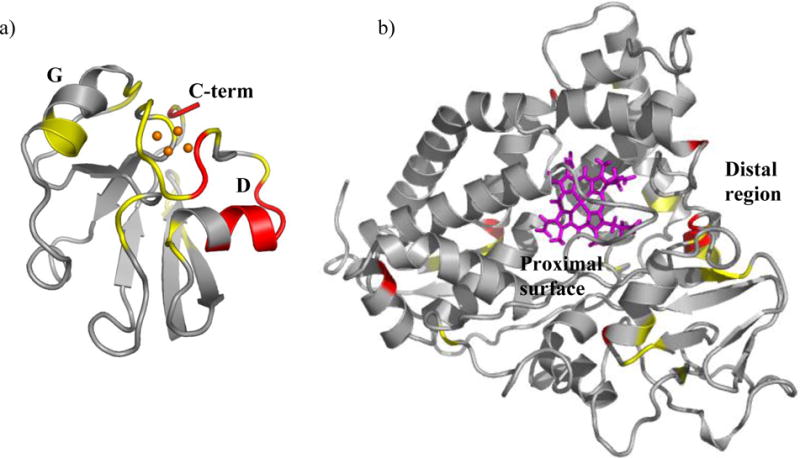
Figure 1.

Structural regions of Pdx° and CYP101° affected by complex formation. Residues in a) Pdx° and b) CYP101° structures are color coded to show distribution of 1H-15N resonances affected in NMR spectra of Pdx° and CYP101° upon complexation. Those depicted in red are residues whose resonances disappear or broaden severely upon binding of the other partner, while resonances for those in yellow do not disappear but are moderately broadened or perturbed upon binding. The [2Fe-2S] cluster is shown as orange spheres, while heme group is shown in pink. The secondary structure elements of Pdx° are labeled as “D” (helix D), “G” (helix G) and “C-term” (C-terminus). The proximal and distal surfaces of CYP101° are labeled. The figures were prepared using the program PyMOL.62
