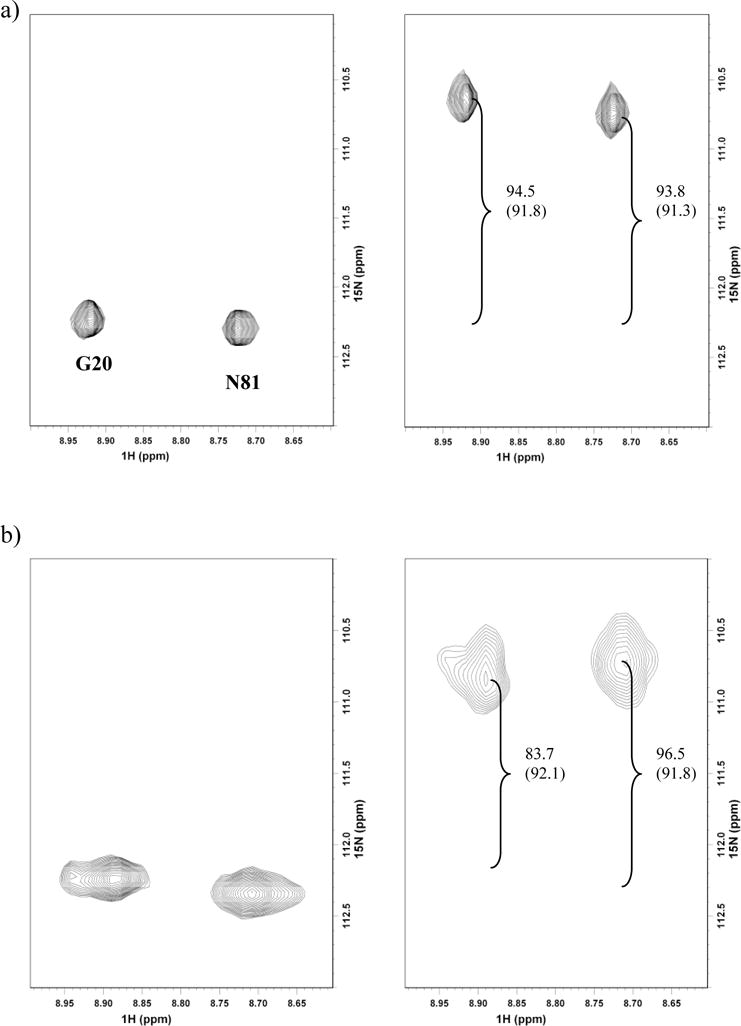
Figure 5.

15N-1H residual dipolar coupling measurements for a representative set of resonances from spectra recorded in a TROSY/semi-TROSY fashion46 at 600 MHz on a) 15N labeled sample of Pdx° and b) 15N,2H labeled Pdx° in complex with unlabeled CYP101°. Both samples were aligned in 5 mg/mL phage solution. 1DNH RDC values are measured from the difference in peak splittings (shown in Hz). Isotropic values of 1DNH are shown in brackets.
