
Figure 2.
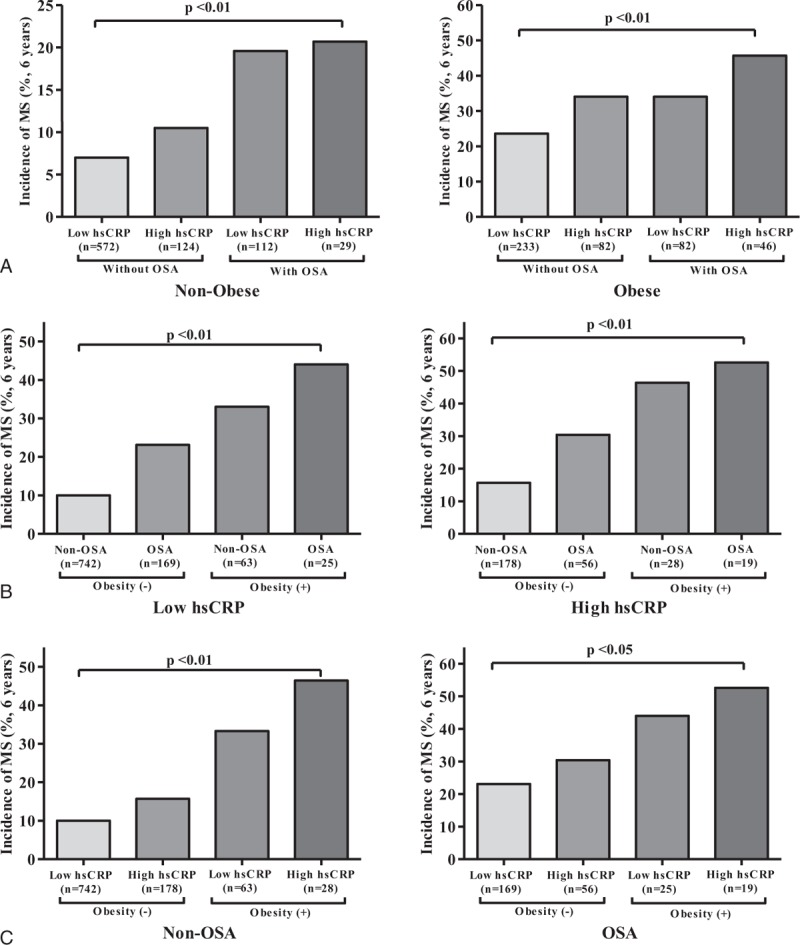
Incidence of MetS among the concurrent status of 4 groups marginally stratified by (A) obesity, (B) inflammation, and (C) OSA, respectively, at 6-year follow-up. An incidence was defined as the percentage of participants who were newly diagnosed with MetS during the 6 years of follow-up period among those without MetS at baseline (n = 1280). MetS = metabolic syndrome, OSA = obstructive sleep apnea.