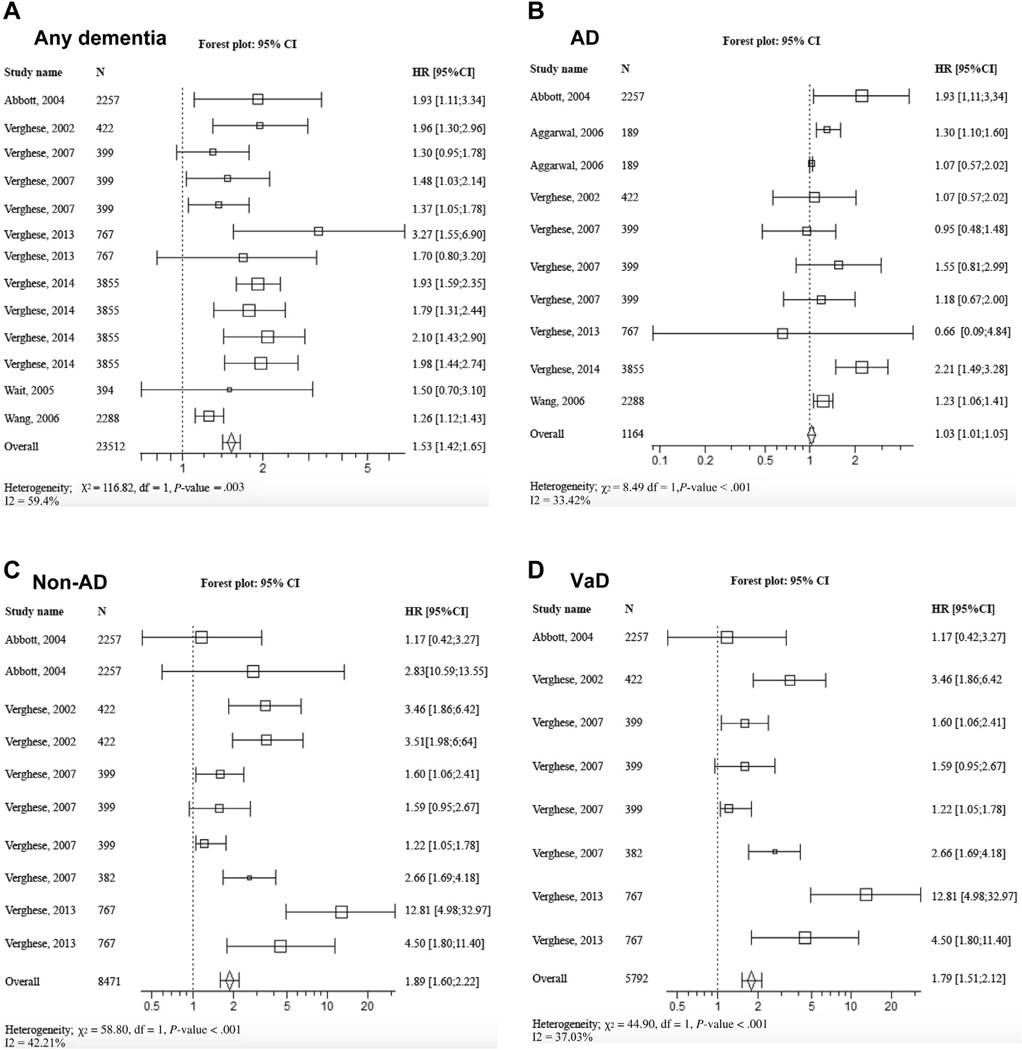
Fig. 2.
Forest plot of pooled estimated HR for risk of incident dementia. (A) Any dementia, (B) AD, (C) non-AD, and (D) VaD in participants with abnormal gait at baseline compared with those with normal gait. Square box area proportional to the sample size of each study; horizontal lines corresponding to the 95% CI; diamond representing the summary value; vertical line corresponding to a HR combined with RR of 1.00, equivalent to no difference.

