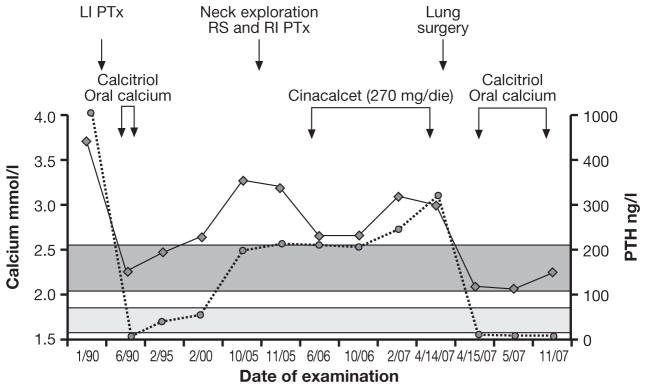
Fig. 2.
Evolution of serum calcium and PTH concentrations in patient #2. The dark grey and light grey areas represent the normal ranges of serum calcium and PTH, respectively. The arrows indicate the date of surgery and medical treatments. LI: left inferior; PTx: parathyroidectomy; RS: right superior; RI: right inferior.

