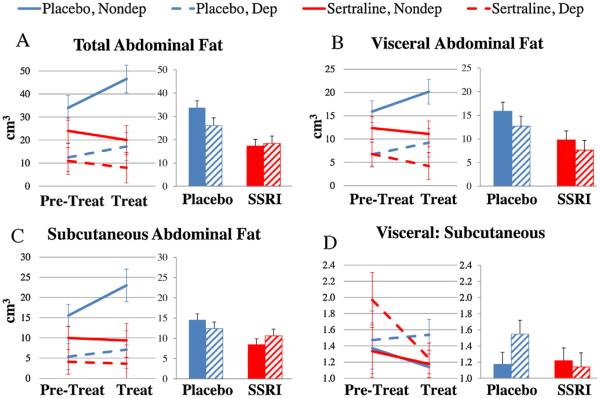
Fig. 3.
The Effects of Sertraline Treatment on Fat Distribution. The data were analyzed using 2 (Pretreatment, Treatment) × 2 (Placebo, Sertraline) × 2 (Nondepressed, Depressed) analyses of variance (ANOVAs). In order to adjust for Pretreatment differences the data were also analyzed by 2 (Placebo, Sertraline) × 2 (Nondepressed, Depressed) analyses of covariance (ANCOVAs) adjusted for Pretreatment values. (A) Total abdominal fat increased during the treatment phase in placebo-treated, but not sertraline-treated monkeys (ANOVA treatment × phase interaction p < 0.001; ANCOVA treatment effect p < 0.001). (B) Visceral abdominal fat volume increased during the treatment phase in placebo-treated, but not sertraline-treated monkeys (ANOVA treatment × phase interaction p = 0.01; ANCOVA treatment effect, p = 0.01). (C) Subcutaneous abdominal fat volume increased during the treatment phase in placebo-treated, but not sertraline-treated monkeys (ANOVA treatment × phase interaction p = 0.01; ANCOVA treatment effect p = 0.01). (D) Sertraline treatment had no effect on the ratio of visceral to subcutaneous fat volumes (ANOVA treatment × phase interaction p = 0.25; ANCOVA treatment effect p = 0.28). Placebo treatment: blue; Sertraline treatment: red. Nondepressed: Solid lines or bars; Depressed: dotted lines or hatched bars (For interpretation of the references to color in this figure legend, the reader is referred to the web version of this article.)

