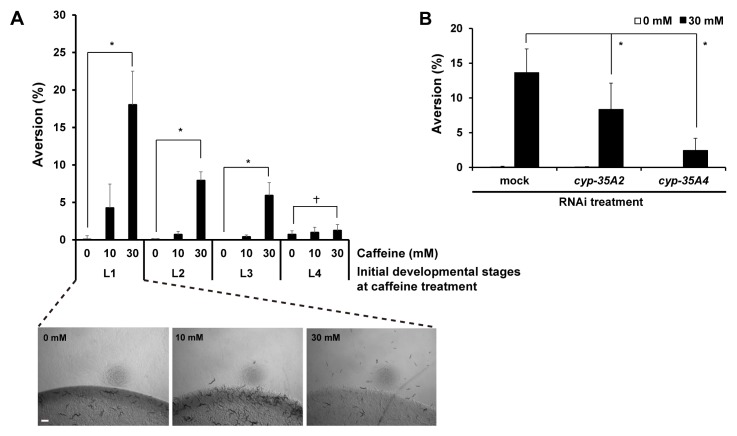
Fig. 1.
Caffeine induced aversion phenotype in C. elegans. (A) Wild-type worms synchronized at the L1 larval stage (0 mM, n = 673; 10 mM, n = 535; 30 mM, n = 565), L2 larval stage (0 mM, n = 649; 10 mM, n = 531; 30 mM, n = 536), L3 larval stage (0 mM, n = 847; 10 mM, n = 348; 30 mM, n = 487), and L4 larval stage (0 mM, n = 249; 10 mM, n = 322; 30 mM, n = 306) were cultured on NGM agar plates containing 0, 10, or 30 mM caffeine, and their aversion phenotype was observed 24 h after caffeine treatment at 20°C. Representative images of worms treated with 0, 10 or 30 mM caffeine when they were at the L1 larval stage are shown under the graph. (B) The caffeine-induced aversion phenotype after RNAi depletion of cyp-35A2 and cyp-35A4 in wild type. After RNAi depletion, the synchronized L1 larvae were cultured on NGM agar plates containing 0 or 30 mM caffeine, and the aversion phenotype was observed at 24 h after the caffeine treatment (mock RNAi, n = 763; cyp-35A2 RNAi, n = 823; cyp-35A4 RNAi, n = 654). In (A, B), values are shown as average % food aversion from three independent experiments. Bar, 200 μm. Error bars represent s.d. *P < 0.05. †P > 0.05.

