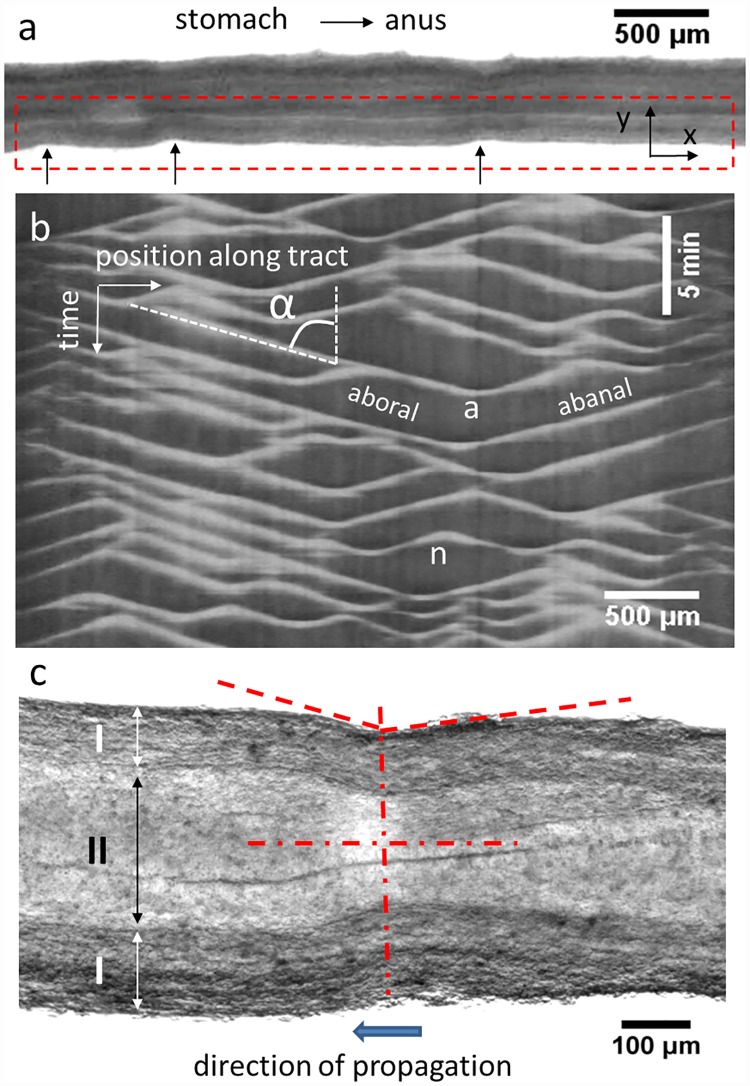
Fig 1. Analysis of embryonic gut motility.
a) Stereomicroscope single frame from a time-lapse stack showing an E9 jejunum resting on an Anodisc membrane. Black arrows: three constrictions travelling from right to left (abanal waves). b) Motiligram (= kymograph) computed from the region-of-interest boxed by red dashed lines in a). Aborally and abanally propagating waves are indicated, as well as wave annihilation (“a”) and nucleation events (“n”); the speed v of a wave is deduced from the tilt angle α by v = tan α. c) Magnified view of a constriction (E8 jejunum). The constriction is not symmetric (dashed red lines): the edge of the gut ahead of the propagating constriction has a steeper incline than the edge of the gut in back of the constriction. I: smooth muscle and myenteric plexus region; II: mucosa, epithelium and lumen region. The deformation (= strain) due to the constriction is concentrated in region II; the thickness of region I does not change during the constriction. The full time-lapse video is available as S1 Video.

