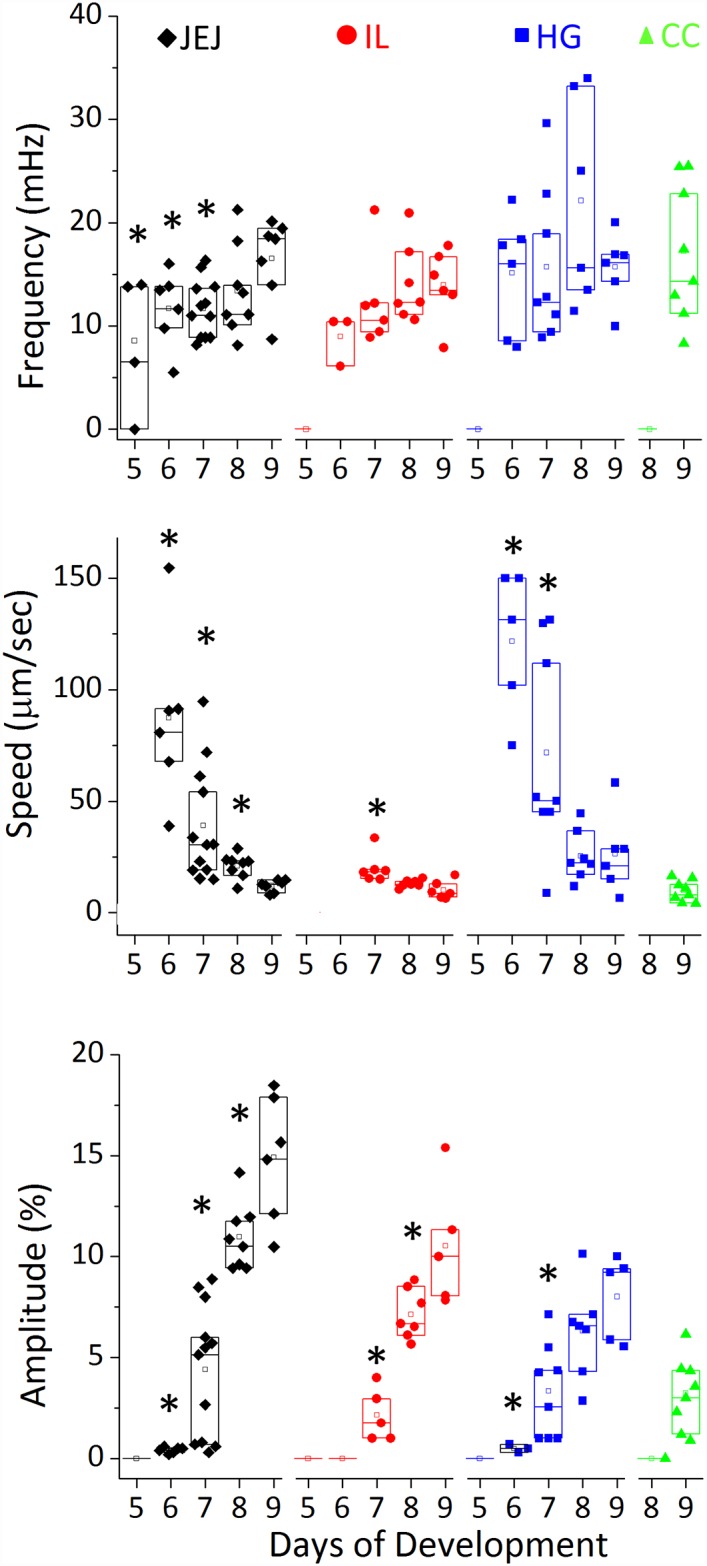
Fig 4. Evolution of peristalsis frequency, wave speed and amplitude as a function of developmental stage.

The minimum number of samples analyzed per stage is: E5 n = 4, E6 n = 6, E7 n = 6, E8 n = 8, E9 n = 5. Speed values for E5 guts and E6 ileum could not be determined as rhythmic contractions were present but were very shallow and appeared as bulk, whole-segment constrictions. Propagative constrictions appeared in the caeca only as from E9. A star indicates that the measured value has a statistically significant difference (p<0.05, Mann-Whitney two-tailed test) compared to the value of the same segment at E9.
