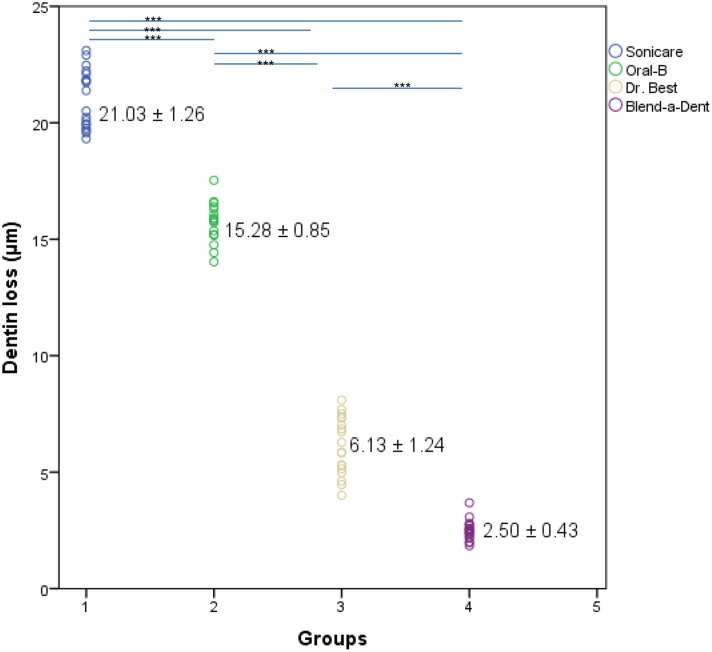
Fig 5. Scatterplot of the relationship between dentin loss and toothbrushes.
Mean and standard deviation change of dentin loss (μm) after brushing with different toothbrushes and different strokes (***p<0.001). Horizontal bars indicate statistically significant differences between groups for power and manual toothbrushes, *** p < 0.001, one-way ANOVA with post hoc.

