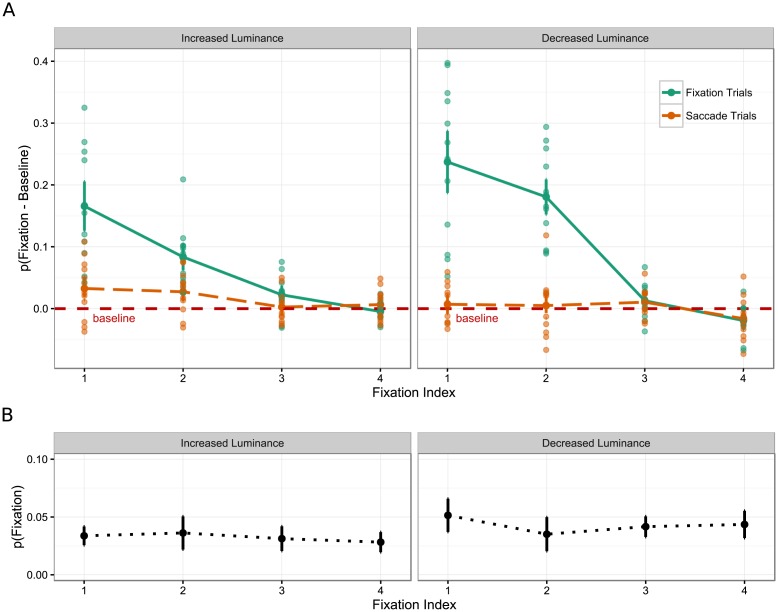
Fig 2. The mean proportion difference from baseline that landed within the bounding box region of the critical object.
(A) For Trial type, Fixation index, and Direction of change. Individual subject mean proportion differences are plotted in lighter shaded points. (B) Baseline object viewing rates. Error bars represent confidence intervals corrected for between-subjects variance [44,45].

