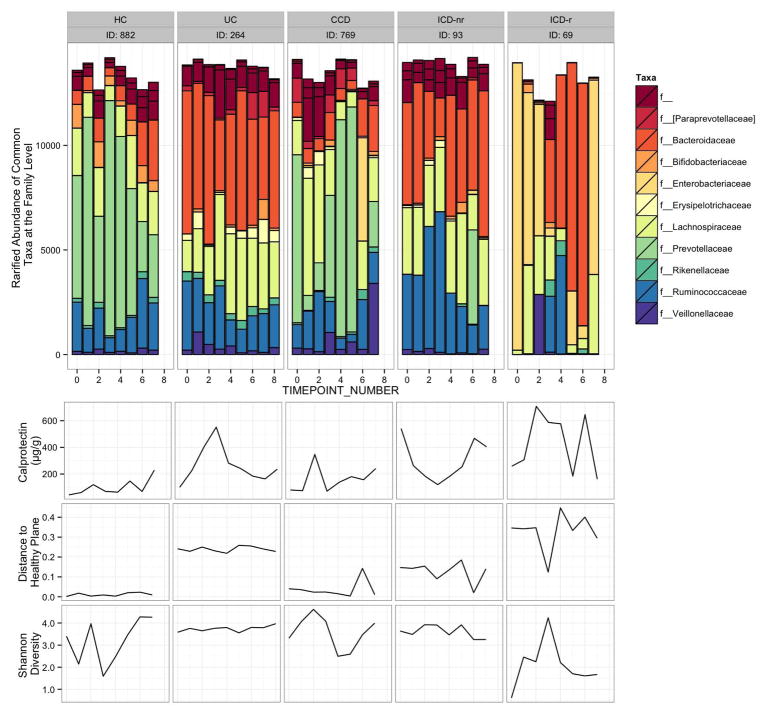
Figure 4. Microbiome dynamics of selected individuals from each IBD subtype and a healthy control.
From each IBD subtype and healthy control group, representative individuals sampled over the most time points and having complete clinical and sequence data were selected. Data represent f-calprotectin values, distance to the healthy plane, and Shannon diversity and rarified abundances of most common taxa at the family level. Note that taxa unclassified at the family level are represented in the ‘f__’ category.

