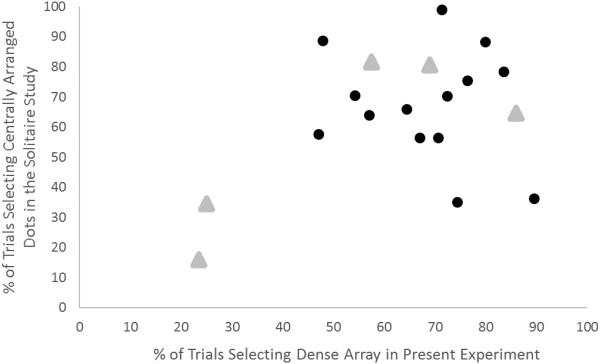
Figure 5.
The percentage of trials in which each monkey selected the centrally arranged dots in the Solitaire illusion studies (Agrillo et al., 2014; Parrish et al., 2016) and the percentage of trials in which the densely arranged array was selected in the present experiment in which both sets had equal numbers of items. Black circles indicate individual capuchin monkeys and grey triangles indicate rhesus monkeys.

