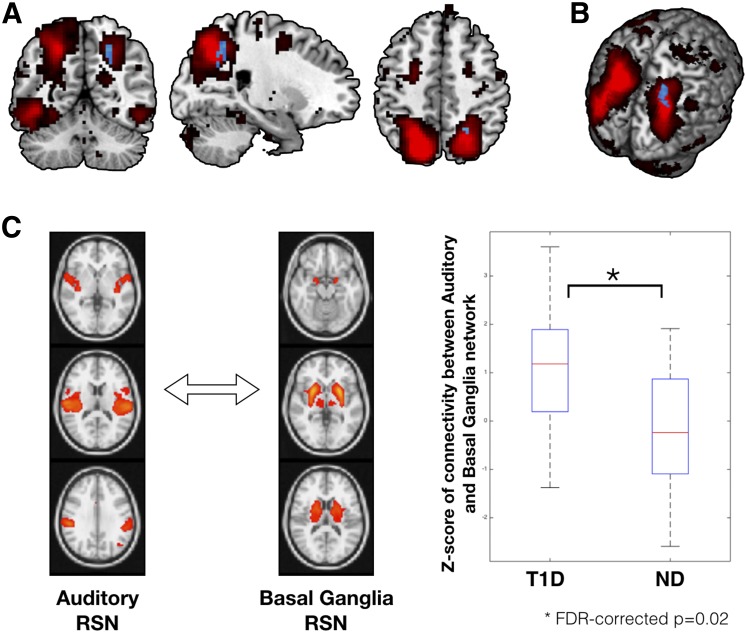
Figure 2.
Results from spatial ICA based on within-network (A and B) and between-network (C) connectivity analysis. A: The DAN, extracted using group ICA, is overlaid on the average MNI-152 brain in red color. Within DAN, significant group differences were observed for a cluster encompassing the region of right superior parietal lobule (peak MNI coordinates: 21, −54, 48; P = 0.024, Student t test value = 3.45) in the direction of T1D > ND (shown in blue color). No group differences were observed for within-DAN connectivity in the reverse direction (i.e., ND > T1D). B: Within-DAN group differences on a three-dimensional rendering of the MNI-152 brain. C: Group differences for the between-network (or long-range) connectivity. Group differences in between-network connectivity were examined for all combinations of RSNs extracted using group ICA (corrected for multiple comparisons; see research design and methods). Out of all between-network connectivity examinations, two networks (auditory and basal ganglia) were found to be significantly different between groups (FDR-corrected P = 0.02). Participants with T1D had significantly higher between-network connectivity than control subjects without diabetes for the auditory and basal ganglia resting-state networks. ND, subjects without diabetes.

