Figure 1.
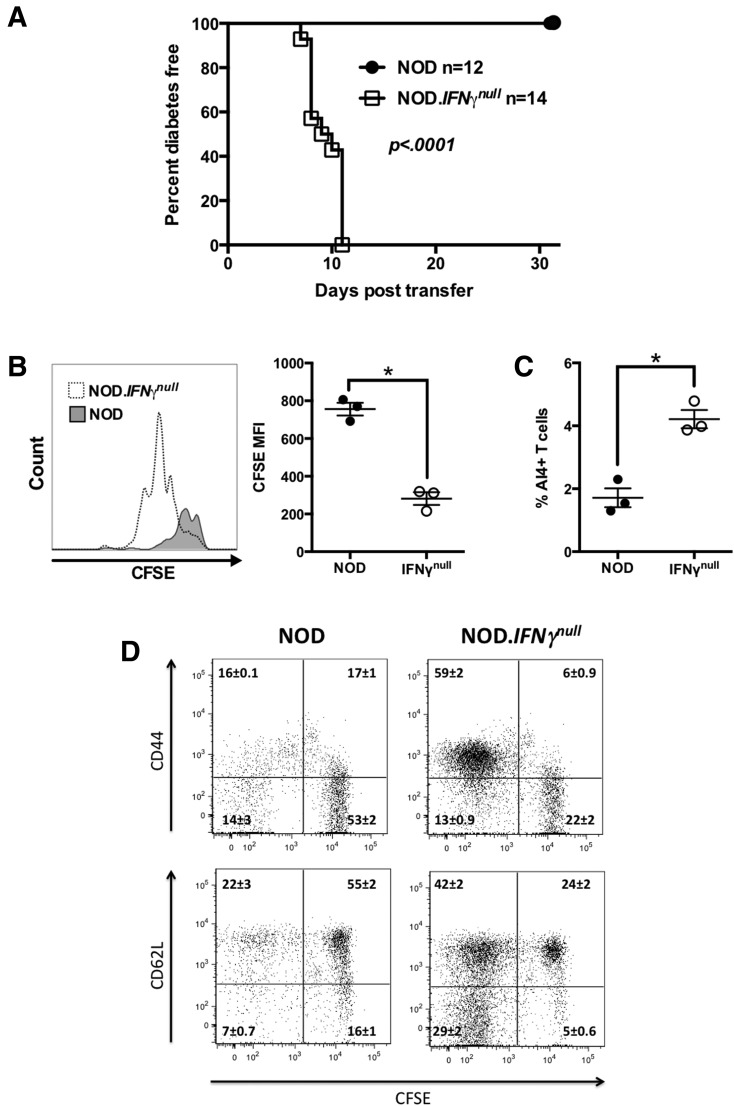
IFN-γ–deficient but not standard NOD mice develop AI4 T cell–induced T1D. A: Diabetes development in female NOD and NOD.IFN-γnull mice injected i.v. at 6 weeks of age with 1 × 10⁷ NOD.Rag1null.AI4 splenocytes. Survival curves compared by log-rank test. B and C: In vivo proliferation and activation of CFSE-labeled NOD.Rag1null.AI4 T cells in PLNs of NOD and NOD.IFN-γnull mice. B: CFSE dilution of AI4 T cells in PLNs of NOD and NOD.IFN-γnull mice at 3 days posttransfer. Representative histograms are shown in the left panel, and mean fluorescence intensity (MFI) of CFSE staining of AI4 T cells is shown in the right panel. C: The frequency of AI4 CD8+ T cells among live PLN cells at 3 days posttransfer. D: CFSE dilution and activation of AI4 T cells in spleens of NOD and NOD.IFN-γnull mice at 8 days posttransfer. Results for each quadrant represent the mean ± SE of three mice per treatment. B–D represent results from a single experiment. *P < 0.05 determined by one-way ANOVA.

