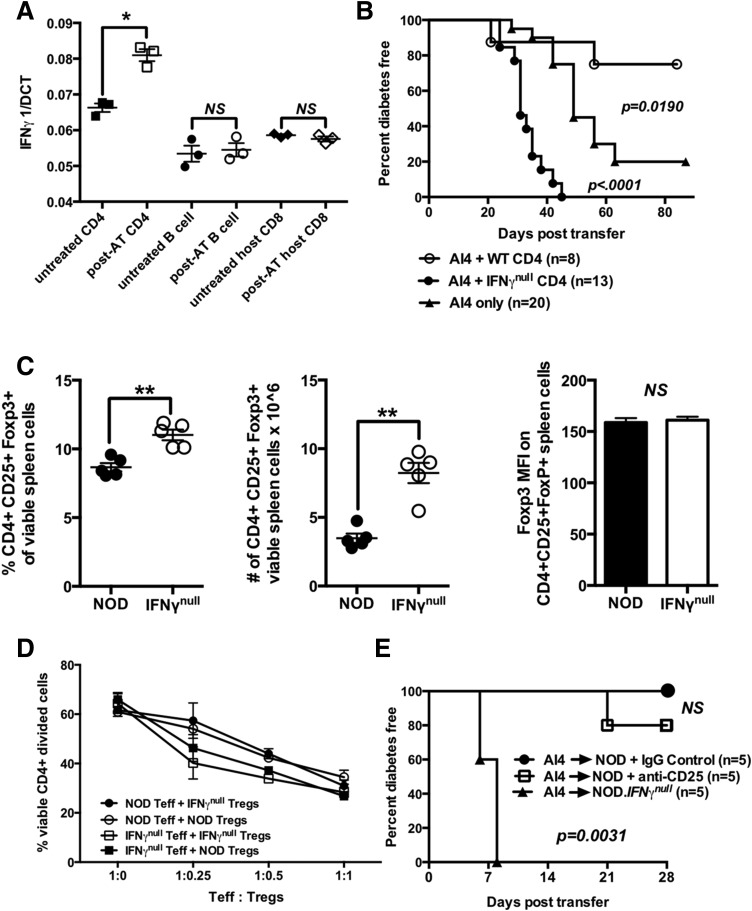
Figure 2.
IFN-γ–producing CD4+ T cells suppress diabetogenic CD8+ T cells through mechanisms that do not involve quantitative or functional variations in Tregs. A: Quantitative PCR analysis of IFN-γ mRNA expression by host-type CD4+ and CD8+ (Vα8−) T cells and B cells purified from spleens of NOD mice 3 days postadoptive transfer with 2 × 10⁷ NOD.Rag1null.AI4 splenocytes (post-AT) or untreated NOD mice (untreated). Results represent the mean ± SE of three samples per treatment. B: Diabetes incidence for female NOD.scid mice injected at 6–8 weeks of age with 1 × 10⁷ NOD.Rag1null.AI4 splenocytes in the presence or absence of 3 × 10⁶ CD4+ T cells purified from NOD or NOD.IFN-γnull donors. C: Frequencies, numbers, and mean fluorescence intensity (MFI) of FoxP3 antibody staining of splenic CD4+CD25+FoxP3+ Tregs in NOD and NOD.IFN-γnull mice. Results represent the mean ± SE of five mice per treatment. D: Crisscross cultures were established to assess the ability of CD4+CD25+ Tregs from NOD and NOD.IFN-γnull mice to suppress the anti-CD3–stimulated proliferation of CD4+CD25− effectors from both strains (assessed by flow cytometic detection of CFSE dilution). E: Beginning at 6 weeks of age, NOD female mice received three biweekly i.p. injections with the Treg-depleting CD25-specific PC61 antibody or a rat IgG1 isotype control. One week after the first treatment, mice in both groups were injected i.v. with 1 × 10⁷ NOD.Rag1null.AI4 splenocytes and subsequently monitored for diabetes. Survival curves compared by log-rank test. *P < 0.05 determined by one-way ANOVA, **P < 0.01 determined by unpaired t test. Teff, effector T cell; WT, wild type.

