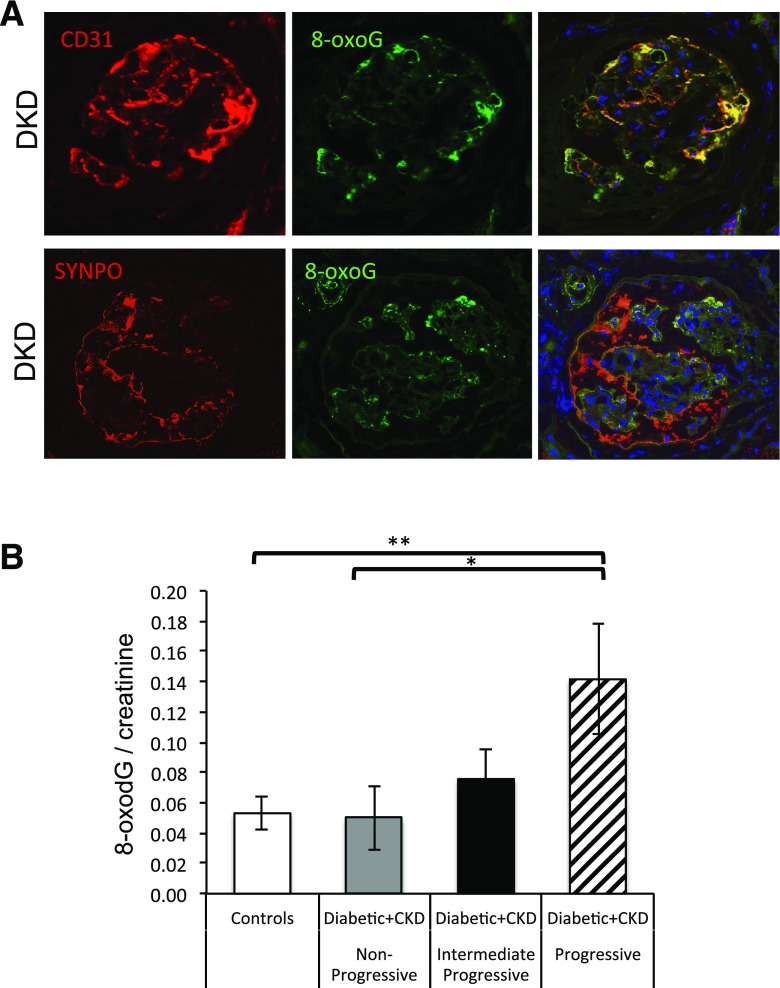
Figure 3.
Diabetes induced mtStress specifically in glomerular endothelial cells. A: Double immunofluorescence staining detecting CD31 (red, top left), 8-oxoG (green, top middle), synaptopodin (SYNPO; red, bottom left), 8-oxoG (green, bottom middle), and merge (top and bottom right) in kidney biopsy from a subject diagnosed with DKD (patient groups in Supplementary Table 2). B: Urine 8-oxodG (nmol) relative to urine creatinine in human control subjects and patients with diabetes with nonprogressive, intermediate progressive, and rapid progressive DKD (Table 1). One-way ANOVA with Tukey posttest was used to compare control patients to patients with progressive, intermediate, and nonprogressive disease. *P < 0.05, **P < 0.01 vs. control subjects. CKD, chronic kidney disease.

