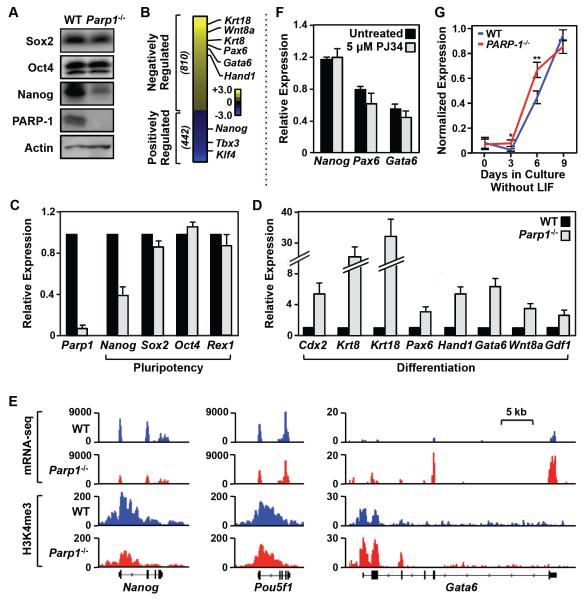
Figure 2. PARP-1 is required for maintaining transcriptional program in embryonic stem cells.
A) Western blots showing the relative levels of three pluripotency factors (Sox2, Oct4, and Nanog) and PARP-1 in WT and Parp1−/− mESCs. Actin is used as an internal loading control.
B) Effect of Parp1 knockout on gene expression in mESCs as determined by RNA-seq. The heatmap shows the relative expression levels of genes whose expression significantly (FDR < 5%) increased upon Parp1 knockout (“Negatively Regulated” by PARP-1) or decreased upon Parp1 knockout (“Positively Regulated” by PARP-1). The data are log2(Parp1−/− RPKM/WT RPKM; RPKM = Reads per kilobase of transcript per million mapped reads).
C) Effect of Parp1 knockout on the expression of pluripotency-associated genes in mESCs, as determined by RT-qPCR. The data for Parp1−/− mESCs are expressed relative to WT ESCs. Each bar represents the mean plus the SEM, n ≥ 3. The differences observed for Nanog and Parp1 are significant (Student’s t test, p-value < 0.05).
D) Effect of Parp1 knockout on the expression of differentiation-associated genes in mESCs, as determined by RT-qPCR. The data for Parp1−/− mESCs are expressed relative to WT ESCs. Each bar represents the mean plus the SEM, n ≥ 3. The differences observed for all of the genes shown are significant (Student’s t test, p-value < 0.05).
E) Genome browser tracks of mRNA-seq data (top) and H3K4me3 ChIP-seq data (bottom) around the Nanog, Oct4, and Gata6 genes in WT and Parp1−/− mESCs.
F) The expression of Nanog (a pluripotency-associated gene), as well as Pax6 and Gata6 (differentiation-associated genes), in undifferentiated (‘Day 0”) mESCs is not affected by treatment with the PARP inhibitor PJ34. RT-qPCR was performed using total RNA isolated from mESCs treated with 5 M PJ34 for 24 hrs. The expression levels we standardized to the expression of the Gapdh gene. Each bar represents the mean plus the SEM, n ≥ 3. The small differences are not significant.
G) Analysis of mRNA expression for a panel of 19 differentiation-associated genes in mESCs during a 9 day time course of differentiation upon LIF removal. The expression levels of each mRNA are normalized to Gapdh mRNA levels and scaled. The individual genes are listed in Fig. S2D. * p = 0.01, ** p = 0.0002.
See also Fig. S2.

