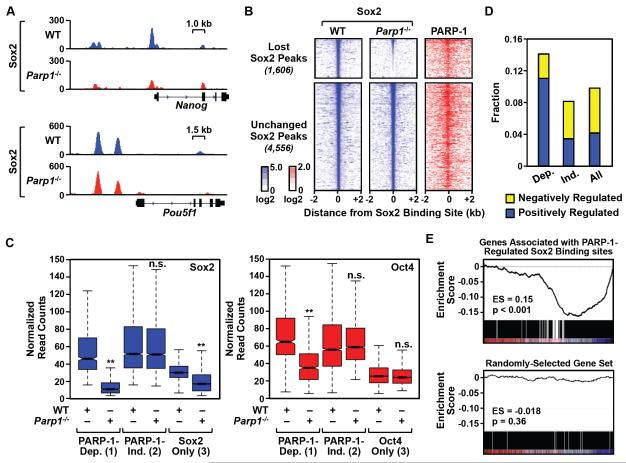
Figure 3. PARP-1 is required for the binding of Sox2 to a subset of its genomic sites in mESCs.
A) Genome browser tracks of Sox2 ChIP-seq data around the Nanog and Pou5f1 (encoding Oct4) genes in WT and Parp1−/− mESCs.
B) Left and middle, Heatmaps of Sox2 ChIP-seq signals in WT and Parp1−/− mESCs centered on the Sox2 binding sites (± 2 kb) and ordered top to bottom by signal intensity. Right, PARP-1 ChIP-seq signals in WT mESCs associated with the corresponding Sox2 binding sites. PARP-1-dependent Sox2 binding sites are defined as those sites whose ChIP-seq signals are significantly decreased upon PARP-1 knockout (p-value < 0.01; n = 1,606,). PARP-1-independent Sox2 binding sites show no change upon PARP-1 knockout (n = 4,556).
C) Normalized ChIP-seq read counts for Sox2 (left) and Oct4 (right) at (1) PARP-1-dependent (Dep.) sites where Sox2 and Oct4 binding overlap, (2) PARP-1-independent (Ind.) sites where Sox2 and Oct4 binding overlap, and (3) sites with Sox2 or Oct4 only. Asterisks indicate significant differences (Student’s t-test, p-value < 2.2 × 10⁻¹⁶).
D) Fraction of genes associated with different categories of Sox2 binding sites. Dep. = PARP-1-dependent Sox2 binding sites; Ind. = PARP-1 independent Sox2 binding sites; All = All Sox2 binding sites. Yellow, Genes whose expression significantly increases upon Parp1 knockout (“Negatively Regulated” by PARP-1). Blue, Genes whose expression significantly decreases upon Parp1 knockout (“Positively Regulated” by PARP-1).
E) GSEA analysis showing the relationship between PARP-1-regulated Sox2 binding sites (n = 1,606) and gene expression changes upon Parp1 knockout in mESCs. Top, The expression of genes associated with PARP-1-regulated Sox2 binding sites is significantly decreased in Parp1−/− mESCs compared to WT mESCs (p-value < 0.001) based on RNA-seq. Bottom, A randomly selected and equally sized set of genes (n = 1,606) shown as a control (p-value = 0.36).
See also Fig. S3.

