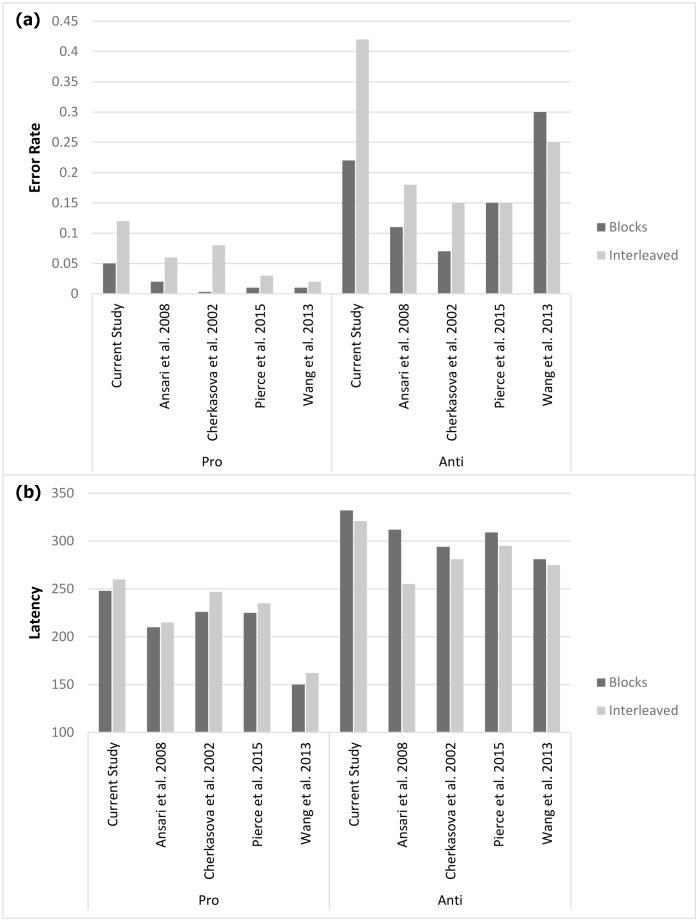
Fig 6. Summary of (a) error rate and (b) latency data extracted from previous studies.
When precise values were not provided we estimated values from graphs. Since Cherkasova et al. [29] did not include collapsed data for "interleaved" condition we used data from "switch" condition. In Wang et al. [40] we sampled the "young" group. In Ansari et al. [28] we averaged data from high and low anxious individuals (since both represent a standard normal sample of college students).

