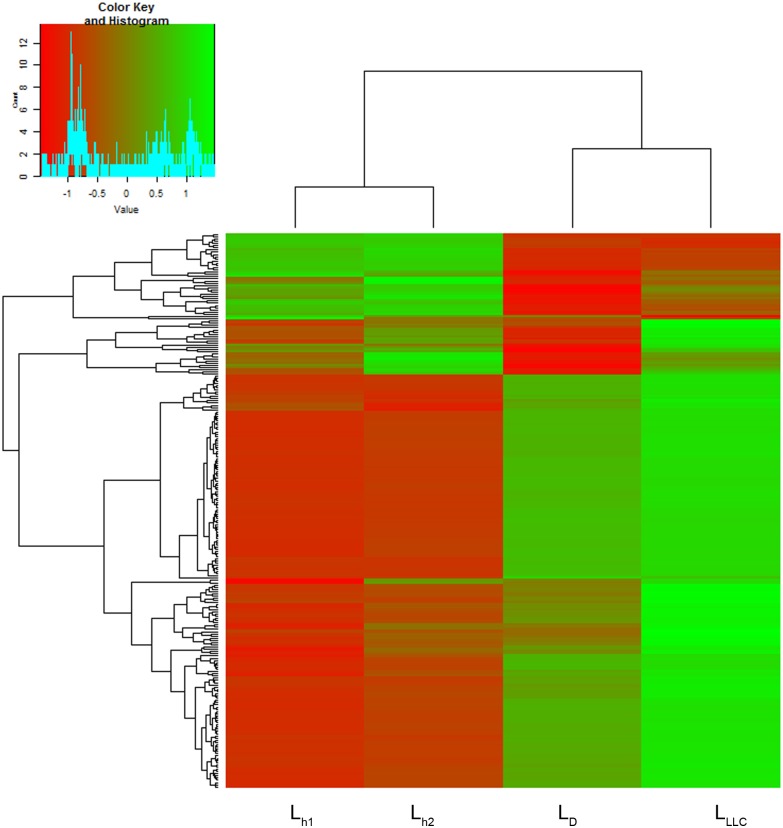
Fig 3. Heatmap on the abundance of tandem repeats in DNA libraries prepared using exDNA from blood serum of healthy mice (Lh1 and Lh2), mice with LLC treated with saline buffer (LLLC) and mice with LLC treated with DNase I (LD).
The decreased and increased tandem repeats are indicated by range of red and green intensities, respectively. Dendrograms were derived by complete linkage clustering of tandem repeats or samples using Euclidean distances between scaled log-transformed RPKM values (Colour Key), respectively.

