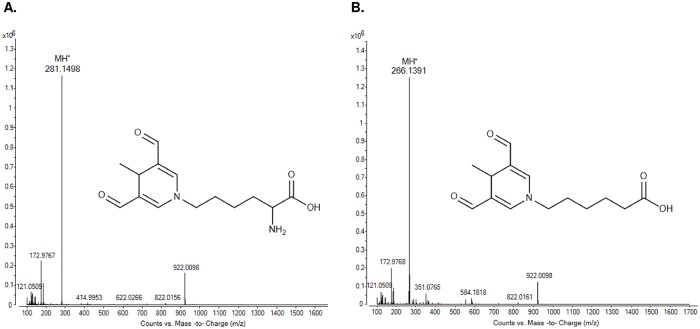
Fig 2. The full scan mass spectrums of MAA-lysine and MAA-6ACA.
(A) The full scan mass spectrum shows the protonated molecular ion for MAA-lysine at m/z 281.1498. Other peaks are minor background ions and reference ions m/z 121.0509 and m/z 922.0098. (B) The full scan mass spectrum shows the protonated molecular ion of MAA-6ACA at m/z 266.1391. Other peaks are minor background ions and reference ions m/z 121.0509 and m/z 922.0098.

