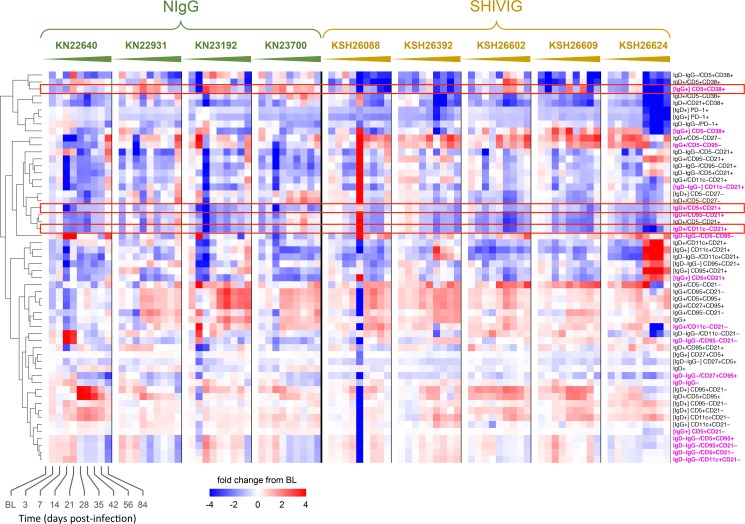
Fig 3. High-resolution longitudinal B cell phenotypic profile.
Heatmap shows data corresponding to the change (log2) from baseline value for each subset frequency at each time point. Paired two tailed t-test for all post-baseline time points vs. baseline was computed independently for NIgG and SHIVIG groups; populations shown had at least one significant time point p<0.01 compared to baseline. Subsets were clustered hierarchically based on Euclidean distance and complete linkage. Magenta subset label indicates a significant difference of at least one time point for the log2 change from baseline between NIgG and SHIVIG groups at p<0.01 as determined by two-tailed unpaired t-test. [X] indicates subset is measured as the frequency of X parent population, otherwise parent population is total CD19+CD20+ B cells. Rectangle outline is used to emphasize select subsets.

