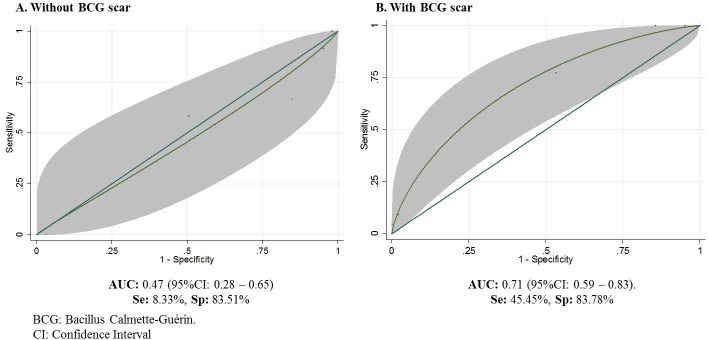
Fig 6. ROC curves showing the predictive capacity of the level of mitochondrial damage to predict active TB development in household contacts of smear-positive patients with or without BCG vaccination.
The gray area shows the confidence interval of AUC (Area Under Curve),Se (Sensitivity), Sp (Specificity).

