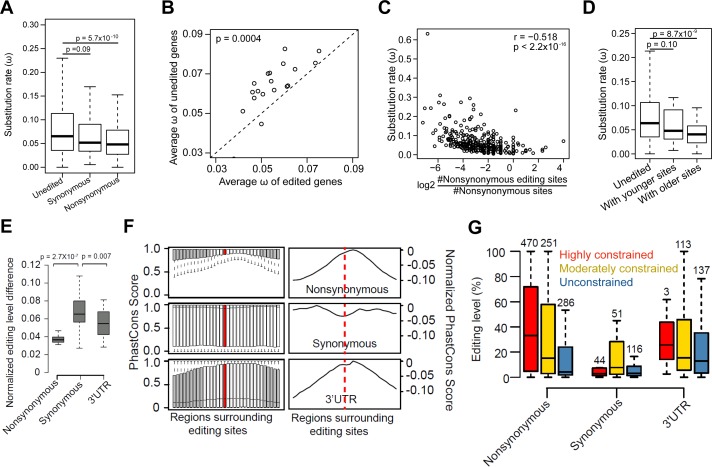
Fig 4. Divergence of editing levels and DNA sequences surrounding nonsynonymous, synonymous, and 3’UTR editing sites.
(A) The comparison of Omega (ω) between genes with nonsynonymous editing sites, genes with synonymous editing sites only, and unedited genes. Unedited genes are genes without any exonic editing sites. P-values were calculated using the Mann-Whitney U test. (B) The comparison of average ω between edited and unedited genes for various Gene Ontology (GO) terms. GO terms with at least 20 edited genes were used for the analysis. P-value was calculated using the paired-sample Wilcoxon test. (C) The relationship between ω of edited genes and the normalized number of nonsynonymous editing sites per gene. The number of nonsynonymous editing sites is normalized by the number of nonsynonymous sites between D.mel and D.sim in the gene. Spearman's ρ is indicated. (D) The comparison of ω for genes with younger or older D.mel editing sites. “Genes with younger sites” refer to genes with editing sites conserved in D.mel or D.sim only. “Genes with older sites” refer to genes with editing sites conserved beyond D.sim. P-values were calculated using Mann-Whitney U test by comparing these genes with unedited genes. (E) The pairwise comparisons of normalized editing level differences between D.mel strains for nonsynonymous, synonymous, and 3’UTR sites. Sites edited at least 20% in one or both strains in the pairwise comparisons were used. For each editing site, the normalized difference is the ratio of editing difference to mean editing level. P-value was calculated using Paired-sample Wilcoxon test. The un-normalized editing level difference is shown in S9A Fig. (F) Conservation of DNA sequences surrounding D.mel editing sites. Left: the PhastCons score distributions for the 60 bp regions flanking the editing sites are plotted separately for nonsynonymous, synonymous and 3’UTR sites using a 30 bp window size (Materials and Methods). Regions that are significantly different (Kolmogorov-Smirnov Tests, fdr corrected p value ≤ 0.01 and D (Kolmogorov–Smirnov statistic, i.e. the distance between two conservation score distributions) ≥ 0.05) from the editing loci (centered, colored red) are colored gray. Right: normalized conservation score, i.e. minus D statistic of the flanking regions of editing loci relative to the region with the highest conservation score. The dashed line indicates the editing site. (G) The comparison of editing levels between highly, moderately constrained and unconstrained D.mel sites. For this analysis, we used the representative editing level of each editing site, which is the maximum editing level across 59 D.mel RNA-seq datasets, including 30 developmental stages and 29 different tissues (Materials and Methods). The editing levels of nonsynonymous and 3’UTR sites were significantly higher than that of synonymous sites (p < 8.7Х10−12 and p < 6.2Х10−11, Mann-Whitney U Test). The editing levels of constrained sites were significantly higher than that of unconstrained sites (p = 6Х10−8). The numbers of editing sites are indicated above the bars.

