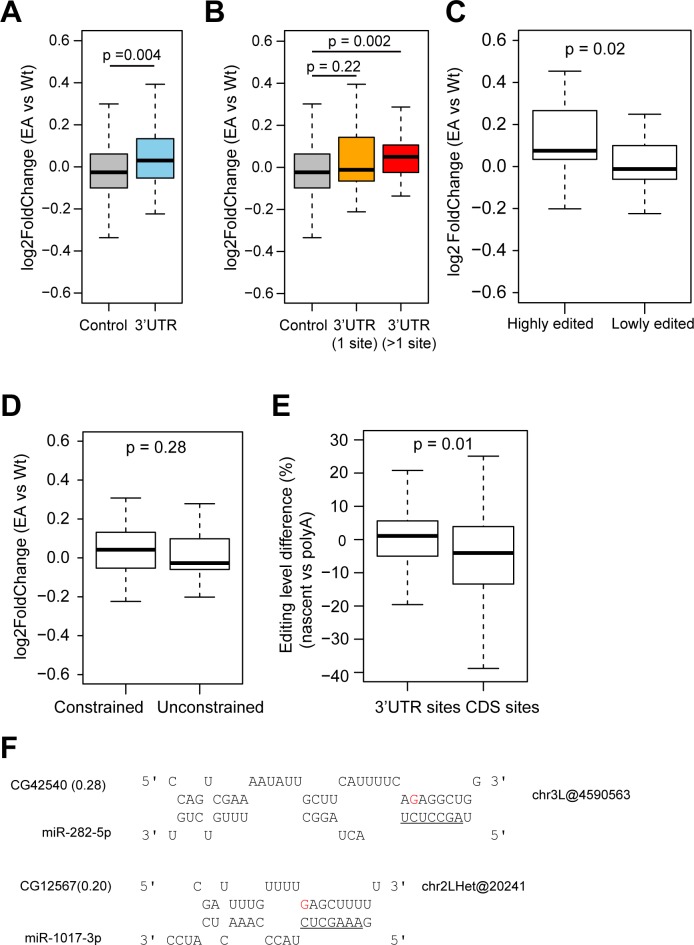
Fig 5. 3’UTR RNA editing is associated with gene expression changes.
(A-B) Gene expression difference between EA mutant and wild type (wt) flies. 3’UTR, genes with 3’UTR editing sites; 3’UTR (1 site), genes with one 3’UTR editing site; 3’UTR (>1 site), genes with more than one 3’UTR editing site; control, genes with 5’UTR or coding editing sites only. Only sites with editing level >5% in the wild type flies were used for analysis. P-value was calculated using the Mann-Whitney U Test. (C) Gene expression difference between EA and wt flies for genes with highly edited (≥50% editing level) or lowly edited (<50%) 3’UTR sites (D) Gene expression difference between EA and wt flies for genes with constrained or unconstrained 3’UTR sites. (E) Editing level difference between nascent and polyA RNA-seq for 3’UTR sites and coding sites. P-value was calculated using the Mann-Whitney U Test. Only sites with read coverage ≥20 in both datasets and editing level >5% in the nascent RNA-seq data were used for analysis. (F) Editing creates putative miRNA target sites. Editing sites are highlighted in red. miRNA seed regions are underlined. Gene expression difference between EA and wt flies is listed in parentheses.

