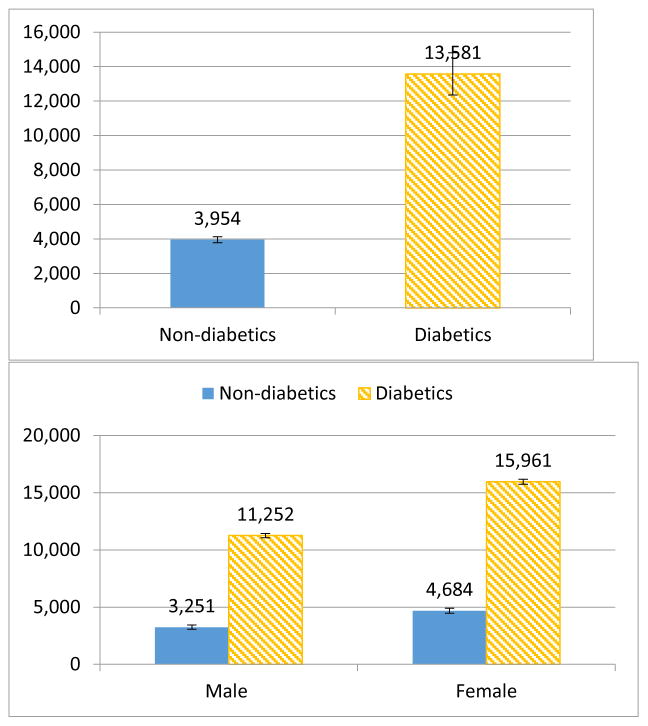
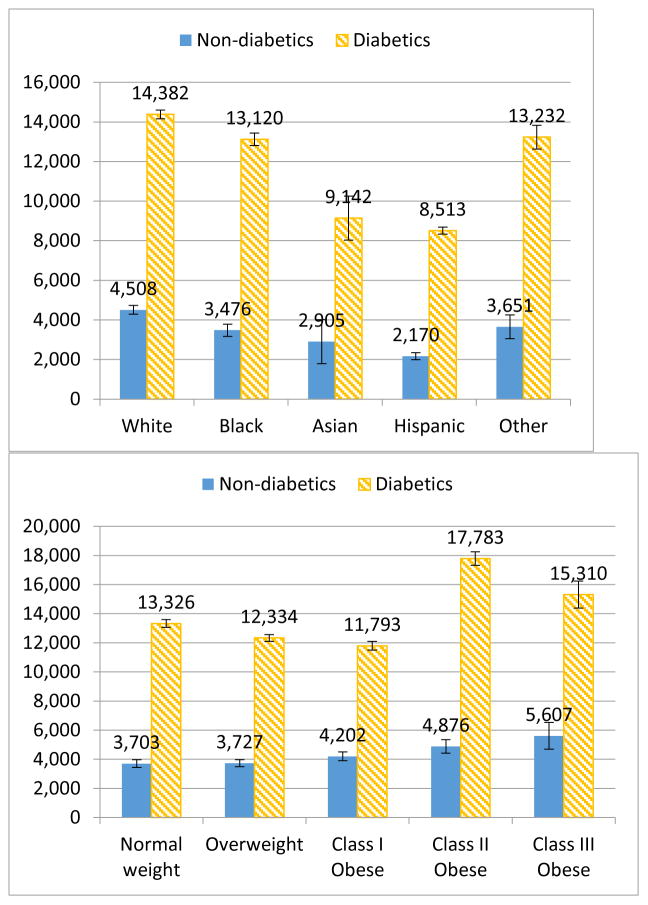
Figure 3.
Mean predicted annual total healthcare* expenditures (2012$) for diabetics and non-diabetics age 50**
*All of the graphs were generated from the result of the multivariable analysis, using the GLM model controlling for age, age square, race (white, black, Hispanic, Asian, other), education level (less than high school, high school diploma, college degree, graduate degree, other degree), household income level as a percentage of Federal Poverty Level (<100%, 100–199%, 200–399%, 400%), census region (northeast, Midwest, south, west), primary source of health insurance (Medicaid, Medicare, private insurance, other public insurance, other public insurance), diabetes-related comorbidities (heart disease, stroke, congestive heart failure, hypertension, high cholesterol, renal failure), year dummies (2009, 2010, 2011, 2012), and current smoker or not. **Results for mean predicted annual total healthcare expenditures (2012$) for diabetics and non-diabetics age 40, 50, and 60 are presented in Appendix Table 3.


