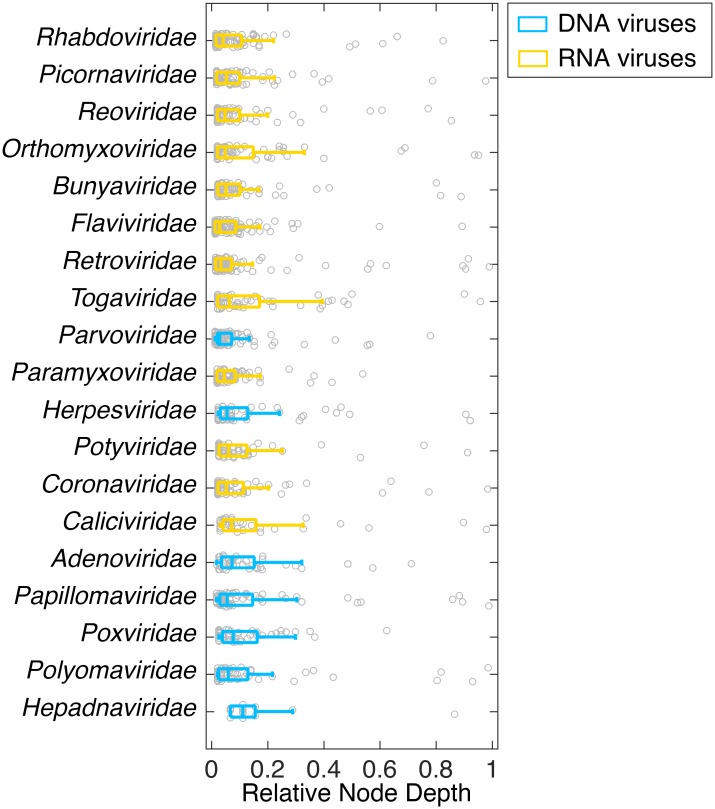
Fig 3. Relative node depths of incongruences between host and virus phylogenies showing the median and 25th and 75th percentiles (boxplots) as well as the raw data.
A relative node depth close to 0 can be interpreted as the occurrence of host-switching events at the tips of the phylogenetic tree, whereas a relative node depth close to 1 suggests host-switching events at the root of the phylogenetic tree. A range of DNA (blue) and RNA (yellow) virus families are shown. For ease of interpretation virus families are ranked as in Fig 2.

