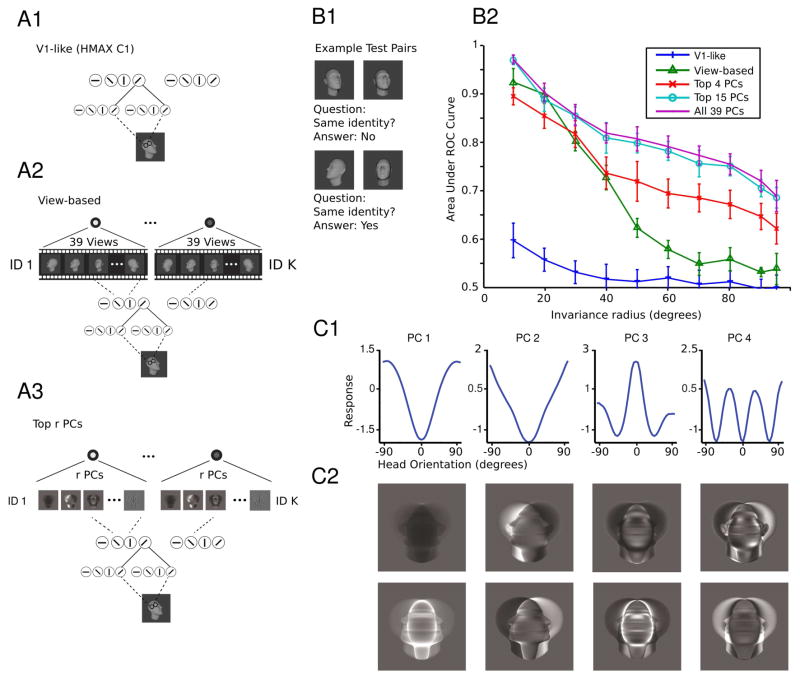
Figure 3. Model performance on the task of same-different face pair matching.
(A1–3) The structure of the models tested in B. (A1) The V1-like model encodes an input image in the C1 layer of HMAX which models complex cells in V1 [14]. (A2) The view-based model encodes an input image as where x is the V1-like encoding. (A3) The Top r PCs model encodes an input image as where x is the V1-like encoding. (B1–2) The test of depth-rotation invariance required discriminating unfamiliar faces. That is, the template faces did not appear in the test set so this is a test of depth-rotation invariance from a single example view. (B1) In each trial, two face images appear and the task is to indicate whether they depict the same or different faces. They may appear at different orientations from each other. To classify an image pair (a,b) as depicting the same or a different individual, the cosine similarity of the two representations was compared to a threshold. The threshold was varied systematically in order to compute the area under the ROC curve (AUC). (B2) In each test, 600 pairs of face images were sampled from the set of faces with orientations in the current testing interval. 300 pairs depicted the same individual and 300 pairs depicted different individuals. Testing intervals were ordered by inclusion and were always symmetric about 0° the set of frontal faces; i.e., they were [−x, x] for x = 5°,…, 95°. The radius of the testing interval x, dubbed the invariance radius, is the abscissa. AUC declines as the range of testing orientations is widened. As long as enough PCs are used, the proposed model performs on par with the view-based model. It even exceeds its performance if the complete set of PCs is used. Both models outperform the baseline HMAX C1 representation. The error bars were computed over repetitions of the experiment with different template and test sets, see Supplemental Methods. (C1–2) Mirror symmetric orientation tuning of the raw pixels-based model. 〈xθ, wi〉2 is shown as a function of the orientation of xθ. Here each curve represents a different PC. Below are shown the PCs visualized as images. They are either symmetric (even) or antisymmetric (odd) about the vertical midline. See also Figure S1.

