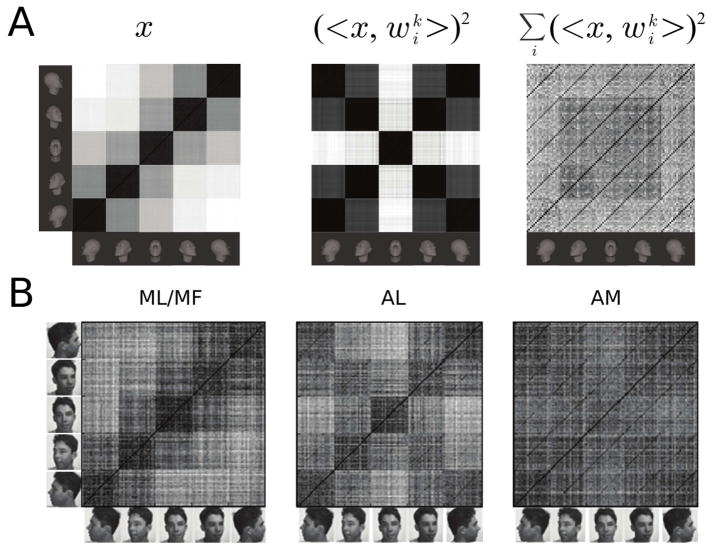
Figure 4. Population representations of face view and identity.
(A) Model population similarity matrices corresponding to the simulation of Figure 3B were obtained by computing Pearson’s linear correlation coefficient between each test sample pair. (Left) The similarity matrix for the V1-like representation, the C1 layer of HMAX [14]. (Middle) The similarity matrix for the penultimate layer of the PCA-model of Figure 3B. It models AL. (Right) The similarity matrix for the final layer of the PCA-model of Figure 3B. It models AM. (B) Compare the results in (A) to the corresponding neuronal similarity matrices from [7]. See also Figure S1.

