. 2017 Feb 21;6:e20420. doi: 10.7554/eLife.20420

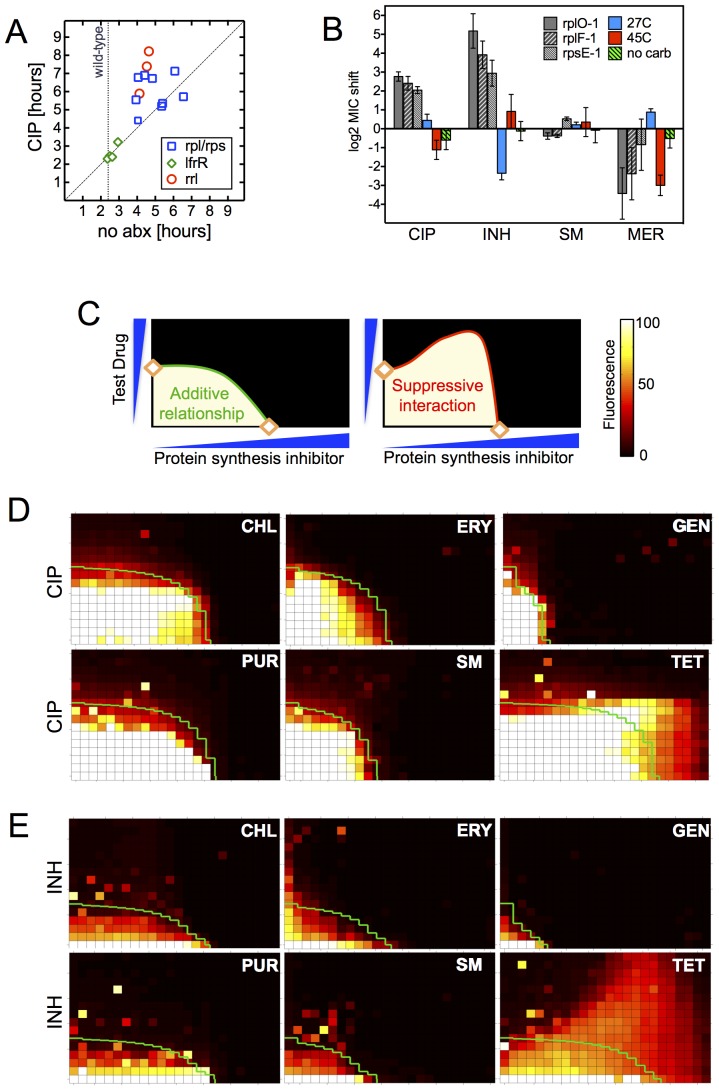
Figure 3. Resistance is not a simple consequence of slowed growth or general inhibition of translation.

(A) Doubling times in antibiotic-free medium (x-axis) or 0.3 μg/ml CIP (y-axis), each dot represents an individual mutant. (B). Shifts in antibiotic sensitivity upon altering growth rate of wild type bacteria by temperature or carbon availability (dextrose/glucose-free medium). Error bars = 95% confidence intervals. See Figure 3—figure supplement 1C for growth rates. (C) Checkerboard assay description: 384-well plates contain increasing concentrations of protein synthesis inhibitors along the x-axis and a second test antibiotic on the y-axis. Growth of M. smegmatis mc2155 (pUV3583cGFP) is measured by fluorescence. If the antibiotics are non-interacting then growth would follow the additive isobole in green (top box, see Supplementary Materials and methods). Antagonistic interactions extend growth beyond the isobole (bottom box). (D) Interaction of protein synthesis inhibitors chloramphenicol (CHL), erythromycin (ERY), gentamycin (GEN), puromycin (PUR) and streptomycin (SM) with CIP. (E) Same as (D) using INH. Tetracycline is unique in demonstrating antagonistic interactions with CIP and INH, phenocopying the ribosomal mutations.

DOI: http://dx.doi.org/10.7554/eLife.20420.009

Figure 3.

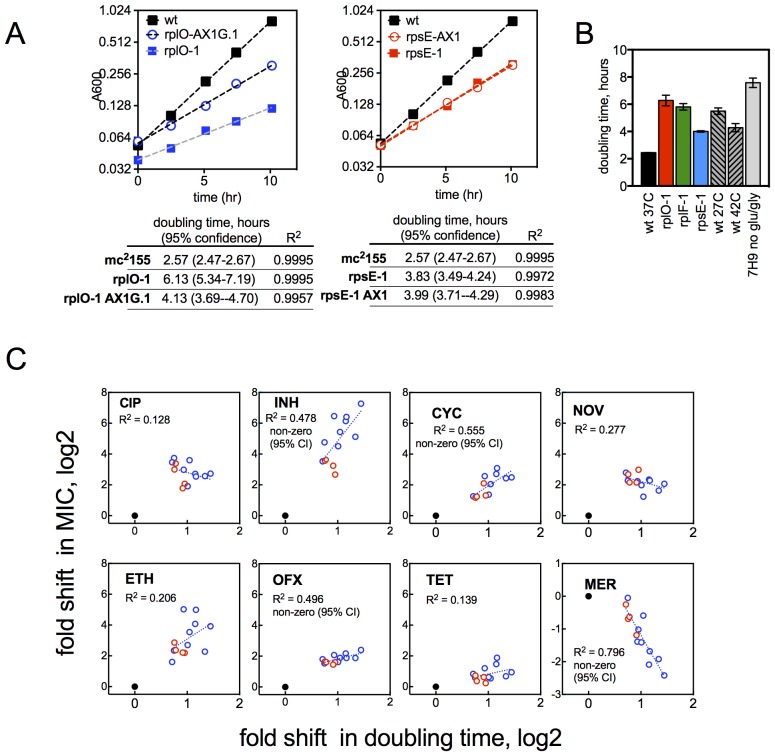
Figure 3—figure supplement 1. Growth rates of mutants and their relationship with resistance levels.

Figure 3—figure supplement 1.

(A) Growth rates of allelic exchange mutants. All strains were grown in 30 ml volumes in foil-sealed Erlenmeyer flasks at 37°C with shaking. At regular intervals, cultures were sampled and density measured based on absorbance at 600 nM. Doubling times were calculated by fitting a line to log2 transformed absorbance values using GraphPad Prism. (B) Doubling times under conditions tested in Figure 3C, with mutants shown for comparison. Mean ±95% CI. (C) Changes in MIC plotted against the doubling time of each mutant for CIP and INH. Dashed line = linear regreasion of data; lfrR mutants, where known to be due to efflux, and the parental strain were excluded from the regression analysis. Doubling time (x-axis) was measured as described in Methods and y-axis is the fold shift in MIC (measured as IC50, determined as described in Methods). CIP = ciprofloxacin, INH = isoniazid, OFX = ofloxacin, SM = streptomycin, NOV= novobiocin, CYC = cycloserine, ETH = ethionamide, MER = meropenem, TET = tetracycline, EMB = ethambutol. Dots represent individual mutants. Black dot is parent, rps/rpl mutants are blue and rrlB mutants are red. Panels note whether the 95% confidence interval of the slope of the fitted line does not span zero, supporting a correlation.