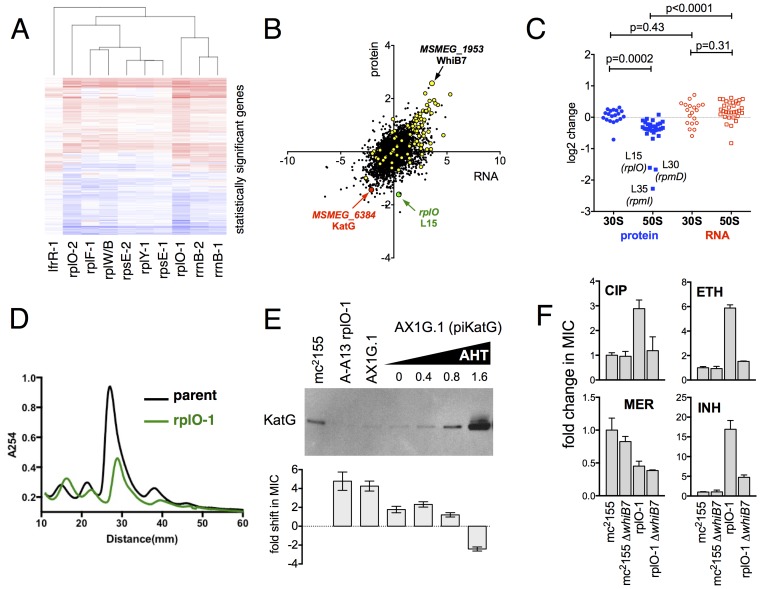
Figure 4. Alterations of the proteome and transcriptome implicate katG and the whiB7 regulon in the altered antibiotic sensitivity of the ribosomal mutants; restoration of wild-type KatG levels restores INH sensitivity.
(A) Hierarchical clustering of transcriptional alterations in representative ribosomal mutants, with lfrR-1 mutant included for comparison. For clustering, any genes whose expression is altered at least twofold and has an adjusted p value of <0.05 in any mutant is included. Source data are available as a Supplement. (B) Correlation between changes in RNA levels (x-axis) and protein levels (y-axis) in the rplO-1 mutant relative to wild type, plotted as log2 of fold change. Changes in both RNA and protein abundance are the averages of two replicate experiments. MSMEG_6384 (KatG) is highlighted in red and RplO (L15) is highlighted in green. Genes upregulated in MSMEG_6129 mutant (Bowman and Ghosh, 2014) (DOI: 10.1111/mmi.12448, supplementary file mmi12448-sup-0002-ts2.xls) are highlighted in yellow. See (C) Alterations in abundance of ribosomal proteins in the rplO-1 mutant relative to is parent strain as detected by iTRAQ (blue), and the corresponding changes in transcript abundance as determined by RNAseq (red). Student’s T-test used for comparing datasets. (D) Comparison of ribosomal preparations separated on 10–40% sucrose density gradient, revealing impaired ribosome assembly in the rplO-1 mutant (green line). (E) Western blot of KatG protein levels in rplO-1 (A–A13), rplO-1 allelic exchange mutant AX1G.1, and rplO-1 AX1G.1 expressing KatG from an AHT-inducible plasmid at various AHT concentrations, shown above a plot of INH MIC under those conditions. As the expression of KatG is restored to wild-type levels, INH susceptibility is also restored. (F) Deletion of whiB7 restores wild-type sensitivity to CIP and ETH but not INH or MER in an rplO-1 background. MICs (IC50) were calculated in PRISM using the ECAnything function to fit outgrowth across a 2-fold dilution series of each drug, and bars show mean ± SD of 2–4 biological replicates.
DOI: http://dx.doi.org/10.7554/eLife.20420.011


