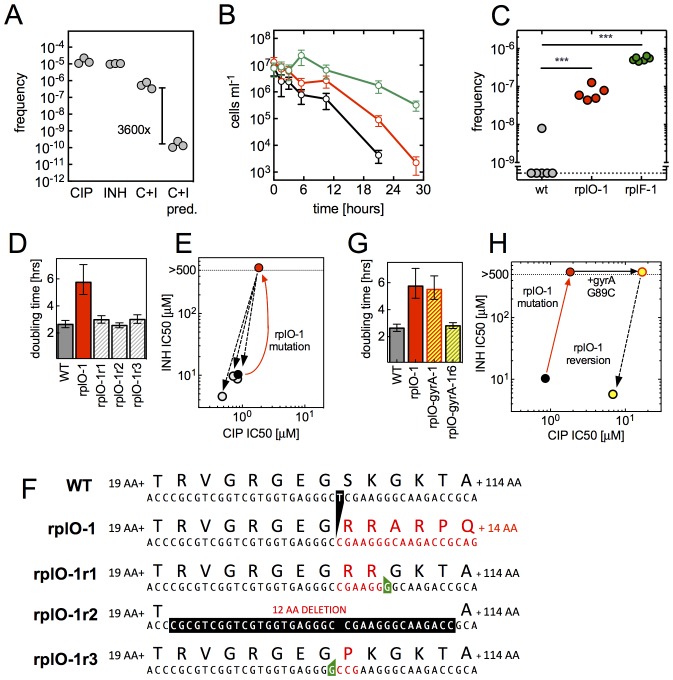
Figure 5. An evolutionary cycle for the acquisition of high-level resistant mutants without fitness cost.
(A) Ribosomal mutations arise during simultaneous selection in two antibiotics. Frequency (per input cell) of resistant mutants from three replicate cultures (individual dots) in CIP (0.3 µg/ml, C), INH (25 µg/ml, I) or CIP and INH in combination (0.3 µg/ml / 25 µg/ml, C+I). C+I predicted = the product of the measured frequencies for each drug individually. (B) Prolonged survival of rplO-1 (red), or rplF-1 (green) relative to wild-type (black) bacteria exposed to 3.5 µg/ml CIP in 384 well plates. (C) Increased frequency of emergence of CIP mutants resistant to >3.5 µg/ml CIP derived from each of the genetic backgrounds in (B), ** = p<0.05, student’s T-test. (D) The growth defect of an rplO-1 mutant (red bar) is reversed after serial passage of 3 independent cultures (hatched bars) to levels similar to wild-type cells (gray bar) (E) Restoration of wild-type CIP and INH sensitivities after serial passage (shading as in D). Dots represent strains shown in (D), with the mutational trajectory indicated by arrows. The x and y axes show the level of susceptibility to CIP and INH. (F) Deletion in rplO (black) leads to a shifted rplO-1 reading frame (red). Compensatory insertions (green) or deletions (black) in rplO-1r1-3 restore the original reading frame (blue). (G) Growth defect of the rplO-1 mutation (red bar) is maintained after acquisition of a gyrA mutation (rplO-1-gyrA, yellow and red hatched bar). Continued passage of rplO-1-gyrA in CIP restores wild-type growth rates (solid yellow bar) (H) Loss of INH resistance after continued selection in CIP Dots represent strains shown in (G), with the mutational trajectory again indicated by arrows. The x and y axes show the level of susceptibility to CIP and INH. (shading as in G).

