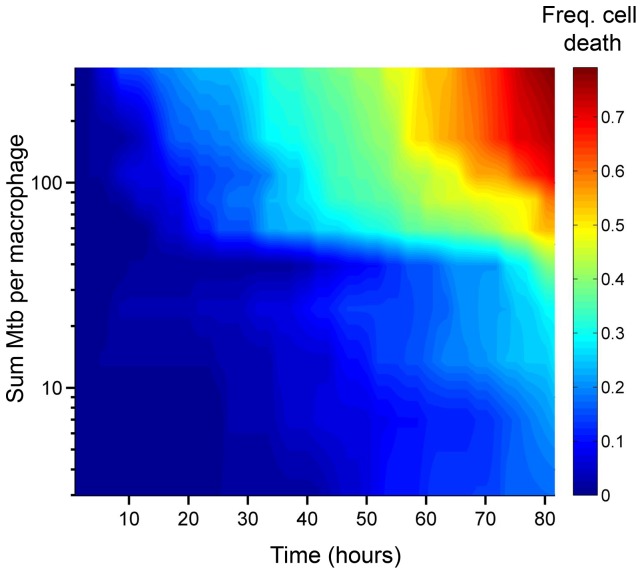
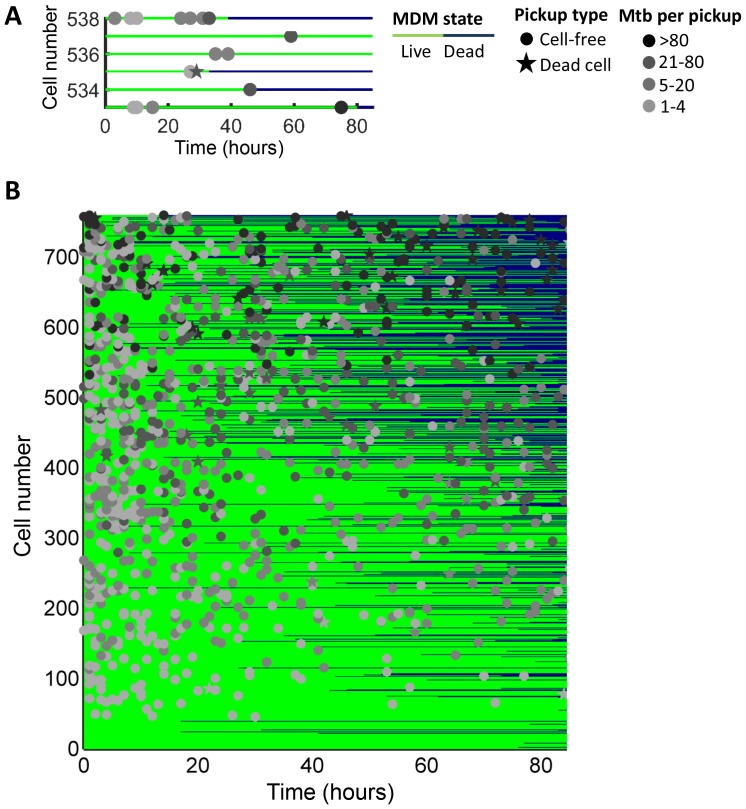
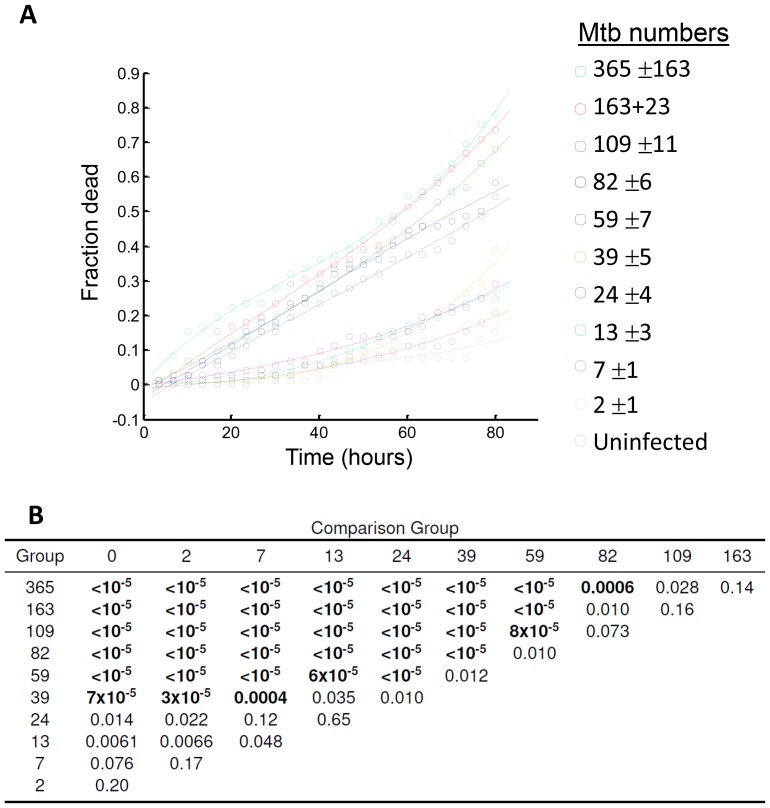
Figure 1. Number of Mtb internalized determines probability of macrophage death.
The death frequency for 720 infected MDM was graphed over time as a function of the sum of Mtb internalized (raw data provided in Figure 1—source data 1). To obtain death frequencies, MDM were divided into 10 groups according to the number of Mtb internalized. The frequency of dead cells was determined at 10 movie frame (1.7 hr) intervals for each group (x-axis), and plotted against the mean sum of Mtb internalized for the group (y-axis). Interpolation between points was performed to obtain a surface. The color scale represents the frequency of cell death from low (blue) to high (red).
DOI: http://dx.doi.org/10.7554/eLife.22028.004
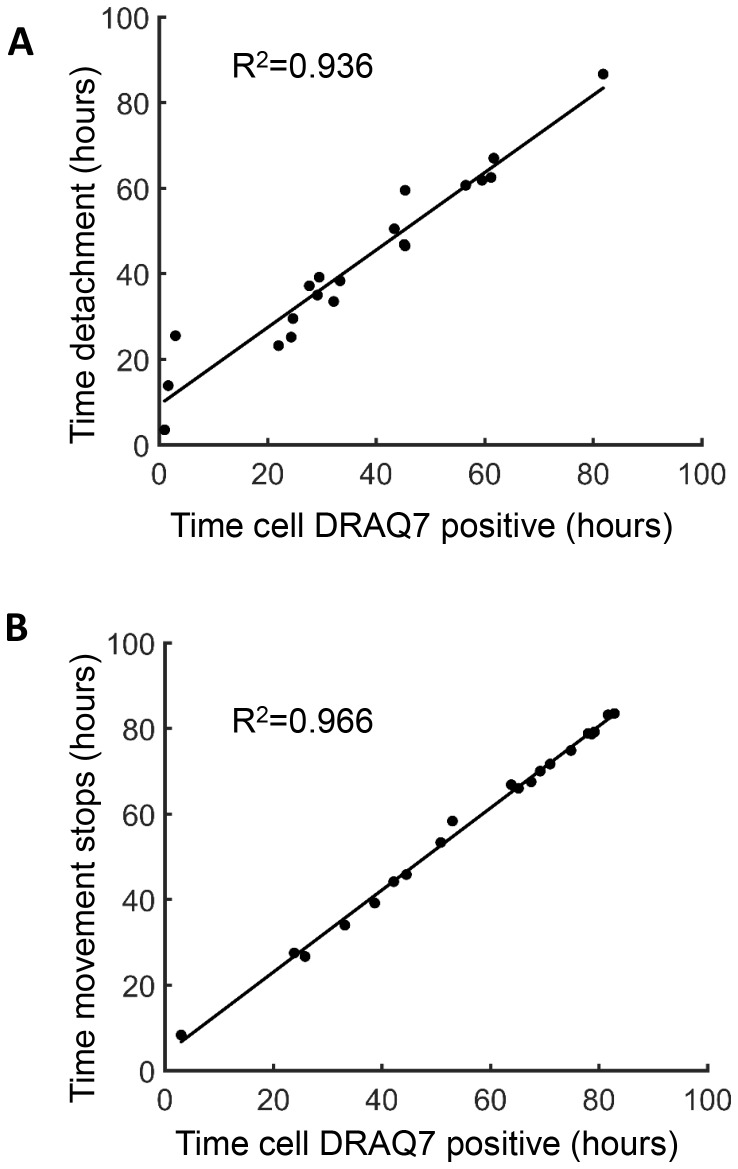
Figure 1—figure supplement 1. Measures of cell death.
Figure 1—figure supplement 2. Fluorescence as a measure of Mtb numbers.
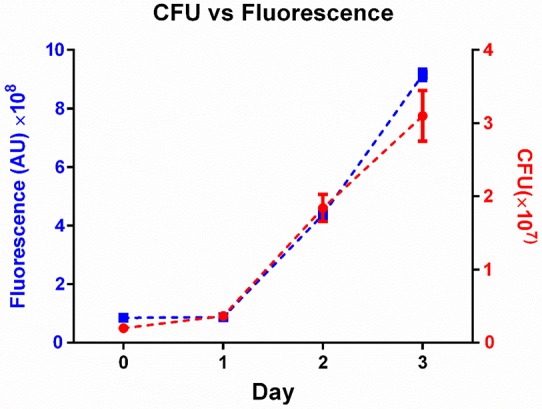
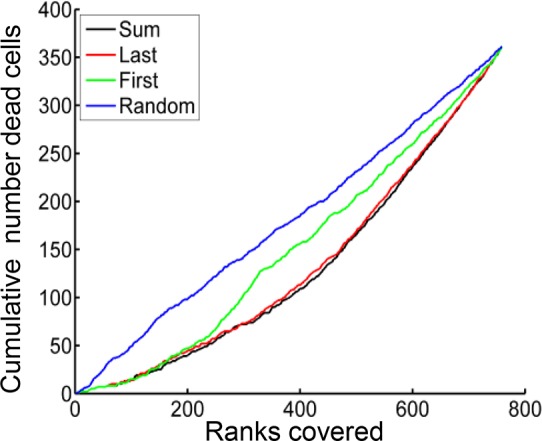
Figure 1—figure supplement 3. MDMs were ranked according to the sum of Mtb internalized (black), number of Mtb in the last aggregate internalized (red), number of Mtb in the first aggregate internalized (green), or randomly (blue).
