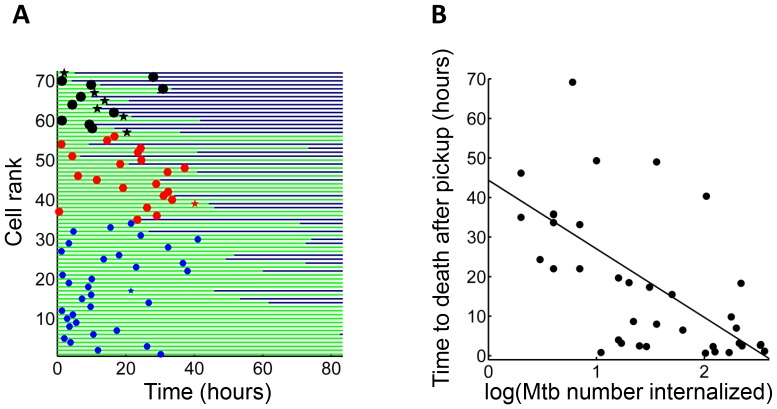
Figure 3. Mtb aggregate size determines timing of macrophage death.
(A) MDMs which internalized exactly one clump before the halfway point of the movie were ranked based on the amount of Mtb internalized (n = 72 cells). The blue circles are internalizations of aggregates of 10 or fewer Mtb, red circles are clumps of 11–49 Mtb, and black circles are >50 Mtb. Line color changes from green to dark blue at time of death. Stars indicate internalizations of dead infected cells. (B) Time differences between internalization and death for cells that died as a function of log transformed bacterial number. R2 = 0.56, p=4×10⁻⁸(n = 39).

