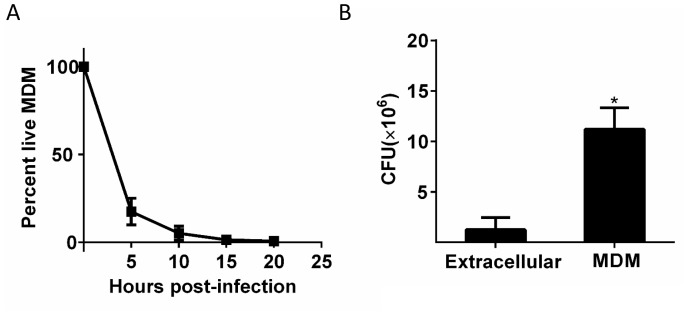
Figure 5. Mtb grows robustly inside dead macrophages.
(A) In silico synchronized images of representative macrophages infected with Mtb and imaged before and after death. Each horizontal set of images represents the same macrophage over time, with the cell death event at the center image. On the left of the cell death event are images of the cell at regular intervals before cell death as a percentage of time the cell was imaged alive. On the right are images at regular intervals after death a percentage of time the cell was imaged dead. (B) Traces of Mtb growth in dead cells. Each trace represents the number of Mtb within the same dead MDM and is normalized to its maximum Mtb number and maximum length of time the dead cell was imaged before detachment or movie end. Minimum time for imaging dead cells was 10 hr. In total, 92 dead macrophages were analyzed, with 90 showing positive exponential slopes. The median doubling time for cells with positive slopes was 24.7 hr over five independent experiments. Inset: Doubling times of Mtb in dead cells excluding the two negative values (red, n = 90) and in the extracellular medium (black, n = 60). The median extracellular doubling time was 36.1 hr.


