. 2017 Feb 21;6:e18554. doi: 10.7554/eLife.18554

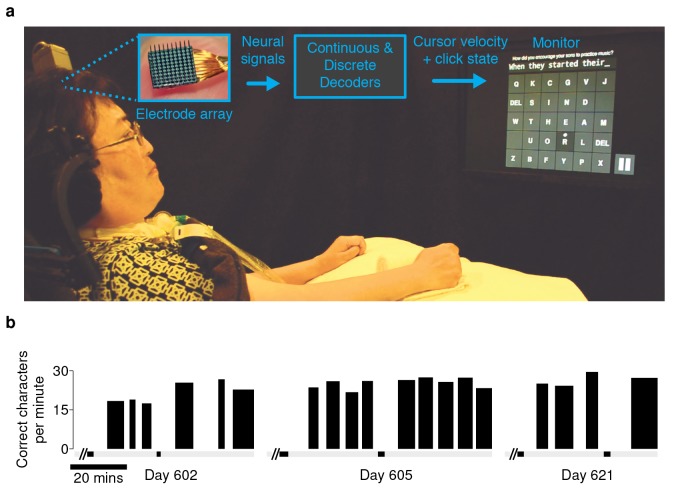
Figure 1. Experimental setup and typing rates during free-paced question and answer sessions.

(a) Electrical activity was recorded using 96-channel silicon microelectrode arrays implanted in the hand area of motor cortex. Signals were filtered to extract multiunit spiking activity and high frequency field potentials, which were decoded to provide ‘point-and-click’ control of a computer cursor. (b) Performance achieved by participant T6 over the three days that question and answer sessions were conducted. The width of each black bar represents the duration of that particular block. The black bands along the gray bar just below the black blocks denote filter calibration times. The average typing rate across all blocks was 24.4 ± 3.3 correct characters per minute (mean ± s.d.). Video 1 shows an example of T6’s free typing. The filter calibration and assessment stages that preceded these typing blocks are detailed in Figure 1—figure supplement 3.

DOI: http://dx.doi.org/10.7554/eLife.18554.003

Figure 1.

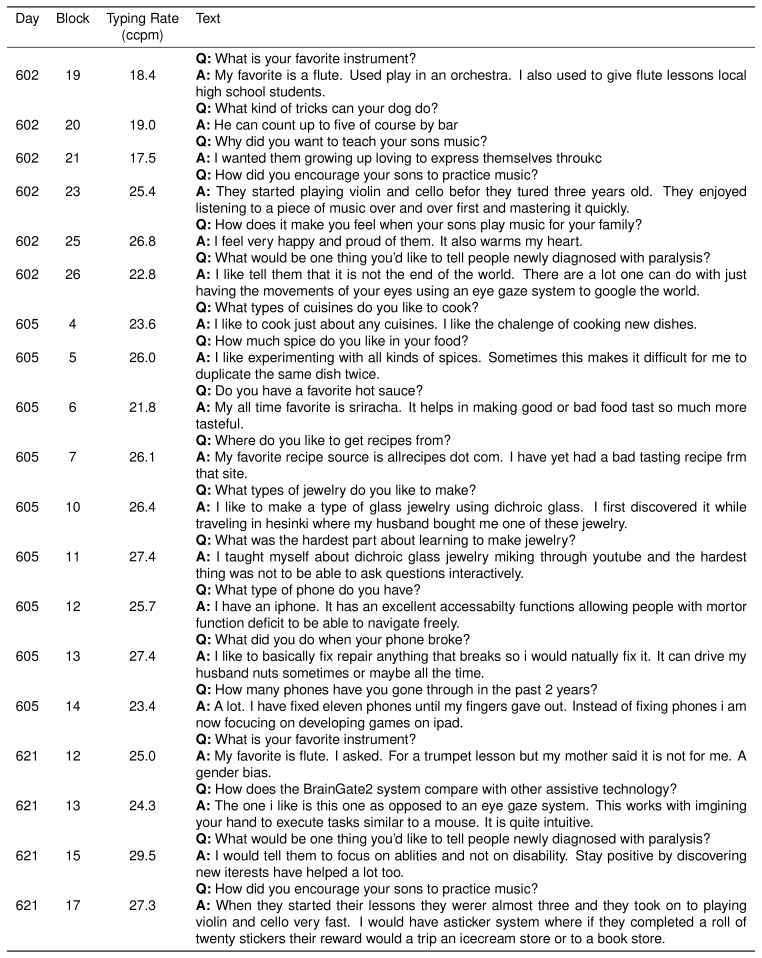
Figure 1—figure supplement 1. Participant T6’s typed responses during the question and answer sessions.

Figure 1—figure supplement 1.

During these sessions, T6 was prompted with questions and formulated responses de novo. She could engage and disengage the interface using a play/pause button (see Video 1). In these sessions, two successive spaces resulted in the insertion of the ‘.’ character in place of the first space. Consent was obtained to release T6’s typed text.

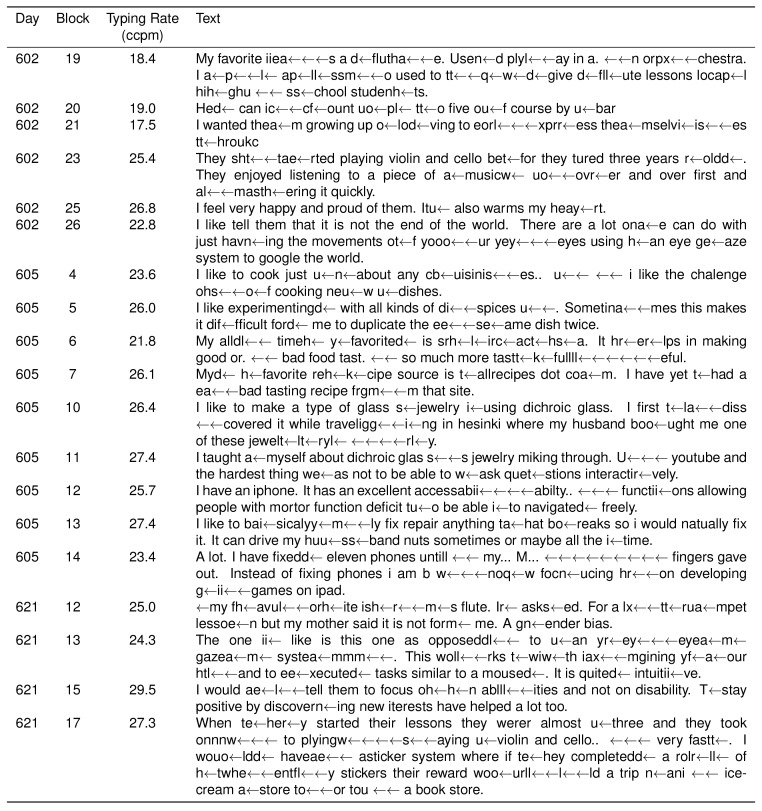
Figure 1—figure supplement 2. Participant T6’s character selection during the question and answer sessions.

Figure 1—figure supplement 2.

Same as previous table, but also includes all errors and backspace characters entered.

Figure 1—figure supplement 3. Filter calibration, assessment, and typing blocks for the ‘free typing’ sessions performed with participant T6.

Figure 1—figure supplement 3.

This expanded figure shows the free typing data presented in Figure 1, as well as the filter calibration and assessment stages that preceded the collection of those data. These sessions were not optimized for filter calibration, rather, performance was achieved and maintained by running evaluation or recalibration blocks at the participant or researchers’ discretion. The black bands along the gray bar just above the x-axis denote filter calibration time. Red bars denote evaluation blocks or blocks where T6 stopped the block early. Blue bars denote uninterrupted blocks of free typing.