. 2017 Feb 21;6:e22914. doi: 10.7554/eLife.22914

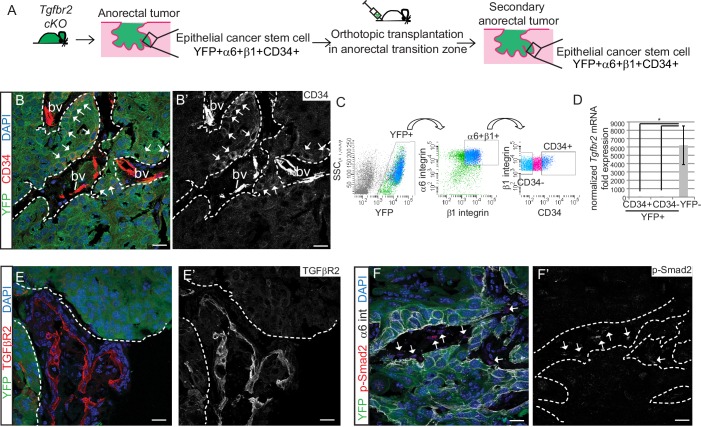
Figure 2. Tgfbr2 cKO CD34+ SCC cells are enriched for in vivo tumorigenicity.

(A) Strategy to generate secondary tumors from the triple transgenic mice K14-Cre; Tgfbr2flox/flox; R26R-eYFPflox-STOP-flox (cKO). (B–B’) Immunofluorescence staining of the secondary anorectal SCC revealed populations of YFP+CD34+ and YFP+CD34− tumor cells, preserving the hierarchy observed in the primary Tgfbr2 cKO tumor. White arrows show the clusters of YFP+CD34+ cells. Dotted lines delineate the tumor from stroma. DAPI counterstains nuclei in blue. See Figure 2—figure supplement 2 for histology and FACS profile of the secondary and tertiary tumors. (C) Using the same FACS strategy as employed for the primary Tgfbr2 cKO anorectal SCC, the secondary anorectal tumors were sorted and distinct CD34+ and CD34− epithelial populations were isolated. (D) FACS-isolated YFP+CD34+ and YFP+CD34− epithelial tumor cells were subjected to mRNA extraction and qPCR and compared to FACS-isolated YFP-negative cells for Tgfbr2 expression. Data represent the mean ± s.d. from three independent tumors; Student's t-test, *p=0.0313. (E–F) Immunofluorescence staining of the secondary anorectal SCC confirmed the loss of TGFβRII (E–E’) and phosphorylated SMAD2 (F–F’) in the epithelial YFP+ cells while expression was maintained in the K14-YFP- stroma (denoted by the white arrows). This is a representative example of 21 secondary tumors analyzed by histology, immunostaining and FACS. Abbreviation: bv, blood vessel. Scale bars = 20 µm.

DOI: http://dx.doi.org/10.7554/eLife.22914.005

Figure 2—source data 1. Values and statistics for Figure 2D using the Wilcoxon matched-pairs signed rank test.
DOI: 10.7554/eLife.22914.006

Figure 2.

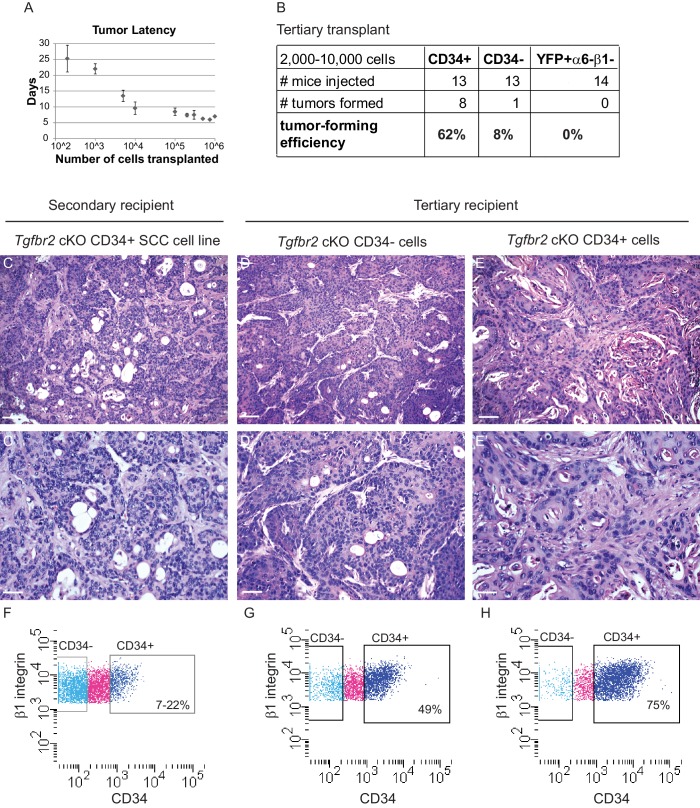
Figure 2—figure supplement 1. Orthotopic transplant of CD34+ cKO SCC cells results in secondary and tertiary tumor formation which recapitulate the hierarchy of the tumor of origin.

Figure 2—figure supplement 1.

(A) Orthotopic transplantation of 200–106 Tgfbr2 cKO CD34+ SCC cells into the anorectal transition zone of recipient nude mice resulted in secondary tumor formation with 100% efficiency (n = 89 in sum; 200 cells, n = 4; 1000 cells, n = 6; 5000 cells, n = 2; 10,000 cells, n = 10; 100,000 cells, n = 44; 200,000 cells, n = 7; 300,000 cells, n = 6; 500,000 cells, n = 4; 750,000 cells, n = 2; 1,000,000 cells, n = 4). Data represent the mean number of days after transplantation before palpable tumor formation ± standard deviation. (B) CD34+ SCC cells were enriched for tumor forming efficiency, compared to CD34− SCC cells or YFP+α6-β1- SCC cells, when transplanted orthotopically into a tertiary mouse. (C–E) H and E staining revealed that orthotopic transplant of cultured Tgfbr2 cKO CD34+ SCC cells into a secondary recipient (C) or orthotopic transplant of Tgfbr2 cKO CD34− SCC cells (D) or orthotopic transplant of Tgfbr2 cKO CD34+ SCC cells directly into a tertiary recipient (E) results in SCC formation which recapitulate the morphology of the Tgfbr2 deficient tumor of origin (n = 1/13 CD34−, n = 8/13 CD34+). Scale bars: 100 µm (C–E), 50 µm (C’–E’). (F–H) Using the same FACS strategy as employed for the primary Tgfbr2 cKO anorectal SCC, the secondary and tertiary anorectal tumors were sorted and distinct CD34+ and CD34− epithelial populations were isolated, maintaining the tumor hierarchy of the Tgfbr2 cKO tumor of origin. Of the one tertiary mouse that developed a tumor from transplant of CD34− cells, CD34 was re-expressed within the tumor environment (G).
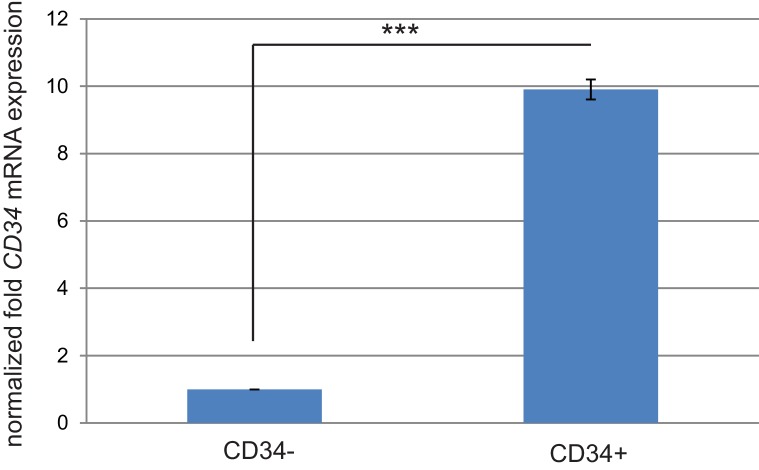
Figure 2—figure supplement 2. CD34 mRNA expression correlates with CD34 protein expression in sorted cKO SCC cells.

Figure 2—figure supplement 2.

Quantitative real-time PCR validated that CD34 mRNA expression is increased in the CD34+ sorted cell populations (two cell lines tested). ***p=0.000013.