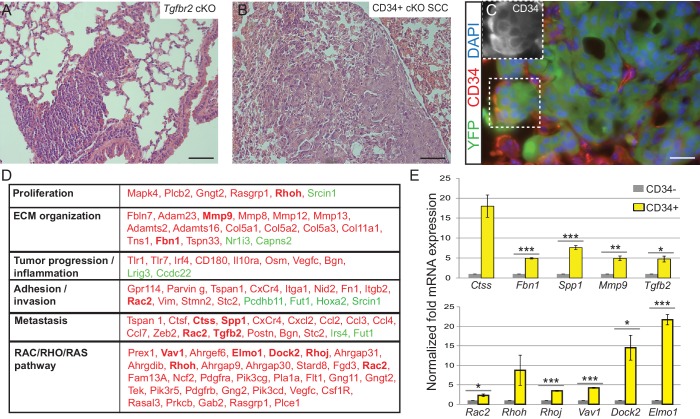
Figure 3. Tgfbr2 cKO CD34+ SCC cells display a metastatic transcriptional signature.
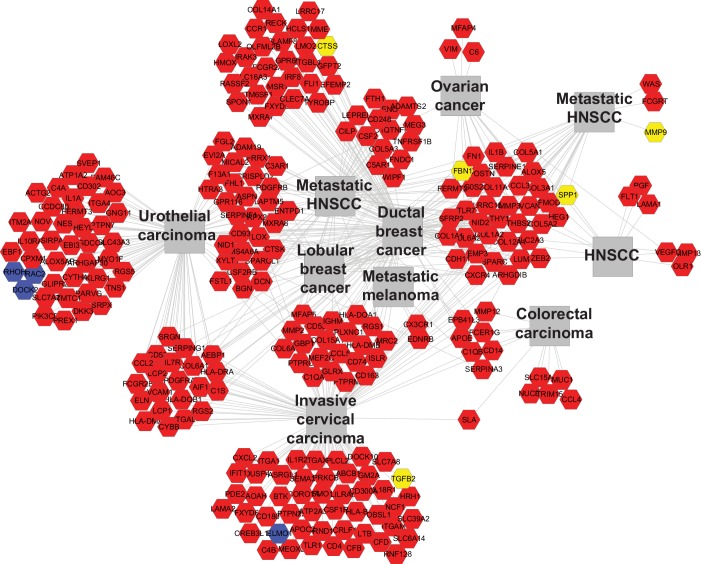
(A–C) H and E staining of the lungs of Tgfbr2 cKO mice (A) and mice orthotopically transplanted with Tgfbr2 cKO CD34+ SCC cells (B) revealed metastatic nodules which are YFP+ and contain a population of CD34+ tumor cells (C). The boxed area represents isolation and magnification of CD34 in the red channel. See also Figure 3—figure supplement 1. (D) RNA-Seq comparison of CD34− and CD34+ cells isolated from Tgfbr2 cKO CD34+ SCC (n = 2 tumors each from two distinct cell lines) revealed that CD34+ SCC cells were enriched for an invasive and metastatic signature. This table represents a selected set of genes which are upregulated (red) or downregulated (green) by more than two fold with an FDR <0.05 in FACS-purified CD34+ cells compared to CD34− cells. Genes in bold were selected for validation by qRT-PCR. See Supplementary file 1 for the full table of differentially expressed genes and Figure 3—figure supplement 2 for comparison with human databases. (E) Selected genes which were upregulated in CD34+ cells compared to CD34− cells in the RNA-Seq analysis were selected for validation by qRT-PCR, including genes involved in ECM organization, adhesion, invasion and metastasis and the RAC/RHO/RAS pathway. Asterisks denote statistical significance using two-tailed, unpaired student’s t-test; Ctss p=0.050895, Fbn1 p***=0.00003, Spp1 p***=0.00035, MMP9 p**=0.00801, Tgfb2 p*=0.016721, Rac2 p*=0.0296, Rhoh p=0.177, Rhoj p***=0.000057, Vav1 p***=0.000032, Dock2 p*=0.02782, Elmo1 p***=0.00067.


