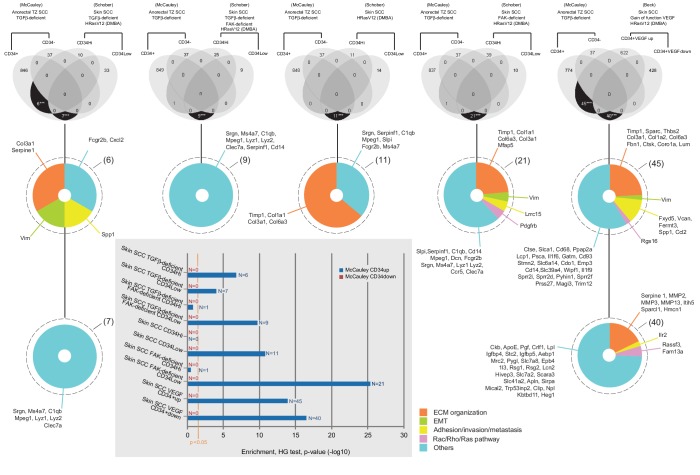
CD34+ and CD34− anorectal TZ SCC TGFβ-deficient signatures (
Supplementary file 1) have been compared with all databases in
Table 1 of
Schober and Fuchs (2011) that are in the same genetic drivers
Tgfbr2-deficient with and without loss of Focal Adhesion Kinase (FAK) using R program available through the Comprehensive R Archive Network. CD34+ and CD34− anorectal TZ SCC TGFβ-deficient signatures have been also compared with other transcriptional profiles of CSC from skin cancers in a TGFβ-intact background (DMBA/TPA treated) in a WT background (
Schober and Fuchs, 2011) and VEGF gain of function (from
Beck et al., 2011),
https://www-ncbi-nlm-nih-gov.gate2.inist.fr/geo/query/acc.cgi?acc=GSE31465). The overlaps represent commonly enriched genes in corresponding populations compared to all others. In a TGFβ-deficient background, only six genes were found significantly commonly highly expressed between the
Tgfbr2 cKO CD34+ SCC anorectal TZ cells and the
Tgfbr2 cKO CD34High SCC skin cells (***p value=1.57×10⁻⁷), seven genes were found significantly commonly highly expressed between the
Tgfbr2 cKO CD34+ SCC anorectal TZ cells and the
Tgfbr2 cKO CD34Low SCC skin cells (***p value=7.48×10⁻⁵) and nine genes were found significantly commonly highly expressed between the
Tgfbr2 cKO CD34+ SCC anorectal TZ cells and the
Tgfbr2/FAK double KO CD34Low SCC skin cells (***p value=1.98×10⁻¹⁰). In a WT background, 11 genes were found common between the
Tgfbr2 cKO CD34+ SCC anorectal TZ cells and the CD34Low SCC skin cells (***p value=1.49×10⁻¹¹) and 21 genes when FAK is deficient (***p value=5.35×10⁻²⁶). In skin SCC with a gain of function of VEGF (
Beck et al., 2011), 45 genes upregulated in CD34+VEGF versus CD34+ skin SCC were found also significantly highly expressed in the
Tgfbr2 cKO CD34+ SCC anorectal TZ cells (***p value=2.62×10-39) and 40 genes downregulated in CD34+VEGF versus CD34+ skin SCC were found significantly highly expressed in the
Tgfbr2 cKO CD34+ SCC anorectal TZ cells (***p value=2.69×10-53). The genes have been listed and classified in five categories: ECM organization, epithelial to mesenchymal transition, adhesion/invasion/metastasis, Rac/Rho/Ras pathway and others. All p values have been calculated with the hypergeometric (HG) test and are represented in the graph. The orange vertical bar indicates the statistical significance at 5%.


