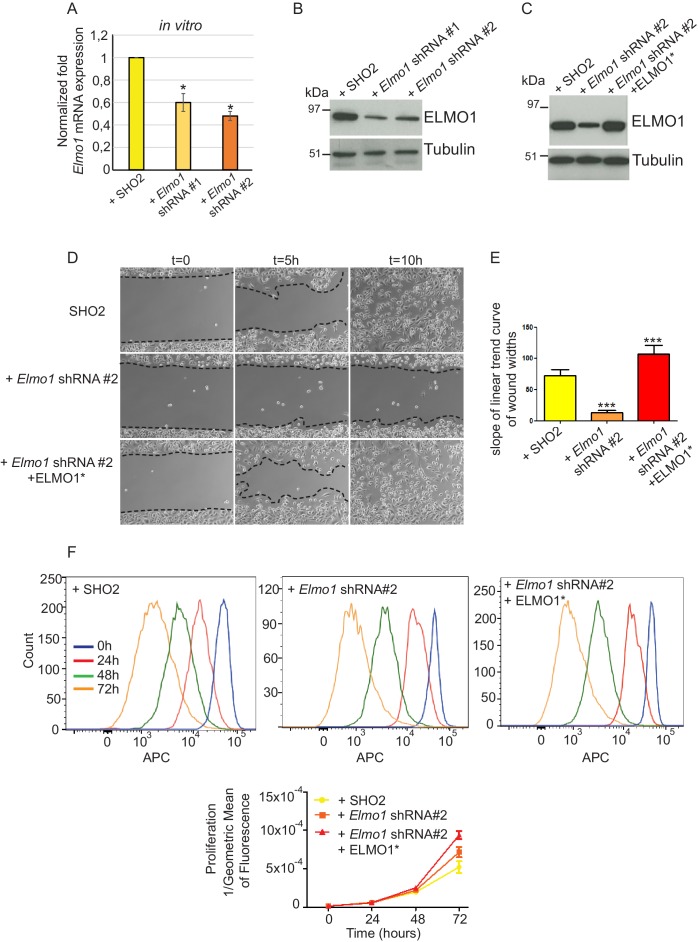
Figure 8. Knockdown of Elmo1 in vitro affects cell migration.
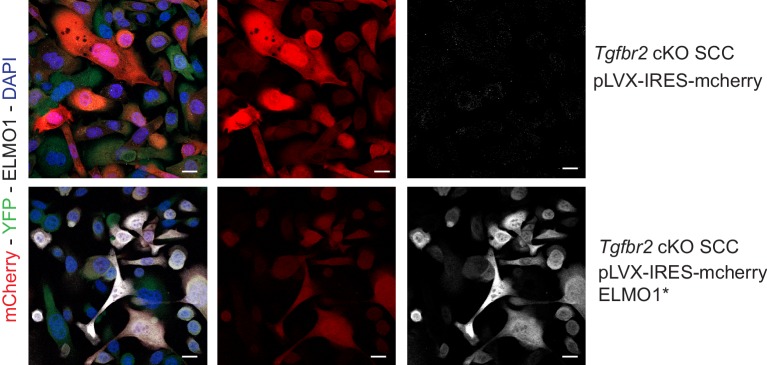
(A) shRNA knockdown of Elmo1 in cKO SCC CD34+ cells with two constructs resulted in 40–50% reduction in endogenous Elmo1 mRNA expression compared to cKO SCC CD34+ cells infected with control shRNA (SH02). Asterisks denote statistical significance using paired-sample Wilcoxon Signed Rank test; p*=0.0350 (Elmo1 shRNA#1), p*=0.0355 (Elmo1 shRNA#2). (B) Western blot analysis confirmed the reduction in endogenous ELMO1 protein in cKO SCC cells compared to cells infected with control shRNA. (C) Western blot analysis confirmed that overexpression of the hairpin-resistant ELMO1 construct (ELMO1*) in the Elmo1 shRNA cKO SCC cells restored expression of Elmo1. See also Figure 8—figure supplement 1. (D–E) Wound healing assay in vitro showed that knockdown of Elmo1 in cKO SCC cells impaired their ability to migrate 5 hr and 10 hr after wounding. This effect was rescued when the hairpin-resistant Elmo1 construct (ELMO1*) is expressed. See also Video 1. (E) Quantification of the wound healing assay showing the slope of linear trend curve of wound widths normalized to SH02 control. For each construct three different cell lines have been tested and the experiments have been repeated five times. Asterisks denote statistical significance using two-tailed, unpaired student’s t-test; p***<0.0001 (Elmo1 shRNA#2), p***=0.0002 (Elmo1 shRNA#2 + ELMO1*). (F) Elmo1 knockdown did not affect cell proliferation. Histograms show the fluorescence of the dye eFluor 670 in the APC channel at 0 hr, 24 hr, 48 hr and 72 hr. Decrease of the fluorescence reflected proliferation by the dilution of the dye over time. Three separate experiments have been done and the mean of the geometric mean for each sample is represented in the graph. There was no statistical difference in cell proliferation between samples calculated by two-way ANOVA and Bonferroni post tests.
DOI: http://dx.doi.org/10.7554/eLife.22914.021


